As of September 2026, the average asking price for apartments for sale in Punta del Este ranges from USD 240.000 in inner neighborhoods to USD 740.000 in Manantiales, depending on the area. These are only averages: many properties are above and below.
How much it costs to buy in each area of Punta del Este
Average price of apartments and houses by area and subarea · September 2026
Survey of 7 September 2026 · 54.787 for-sale listings read on real-estate portals (Maldonado) · 25.968 distinct units after excluding off-plan projects, listings with no price in dollars, and repeated postings of the same unit.
This is the picture of the whole market: everything currently listed for sale in each area, with average price, central range and USD/m², broken down by subzone. The zone comes from how the listing is classified on each portal; the subzone (Parada stops in Mansa and Brava, Pinares, Roosevelt, Golf, San Rafael, Rincón del Indio, Las Grutas, Solanas, Montoya, La Juanita…) comes from the neighborhood and address stated in each listing. The 1, 2 and 3 bedroom columns show the average price, in dollars, for apartments with that number of bedrooms.
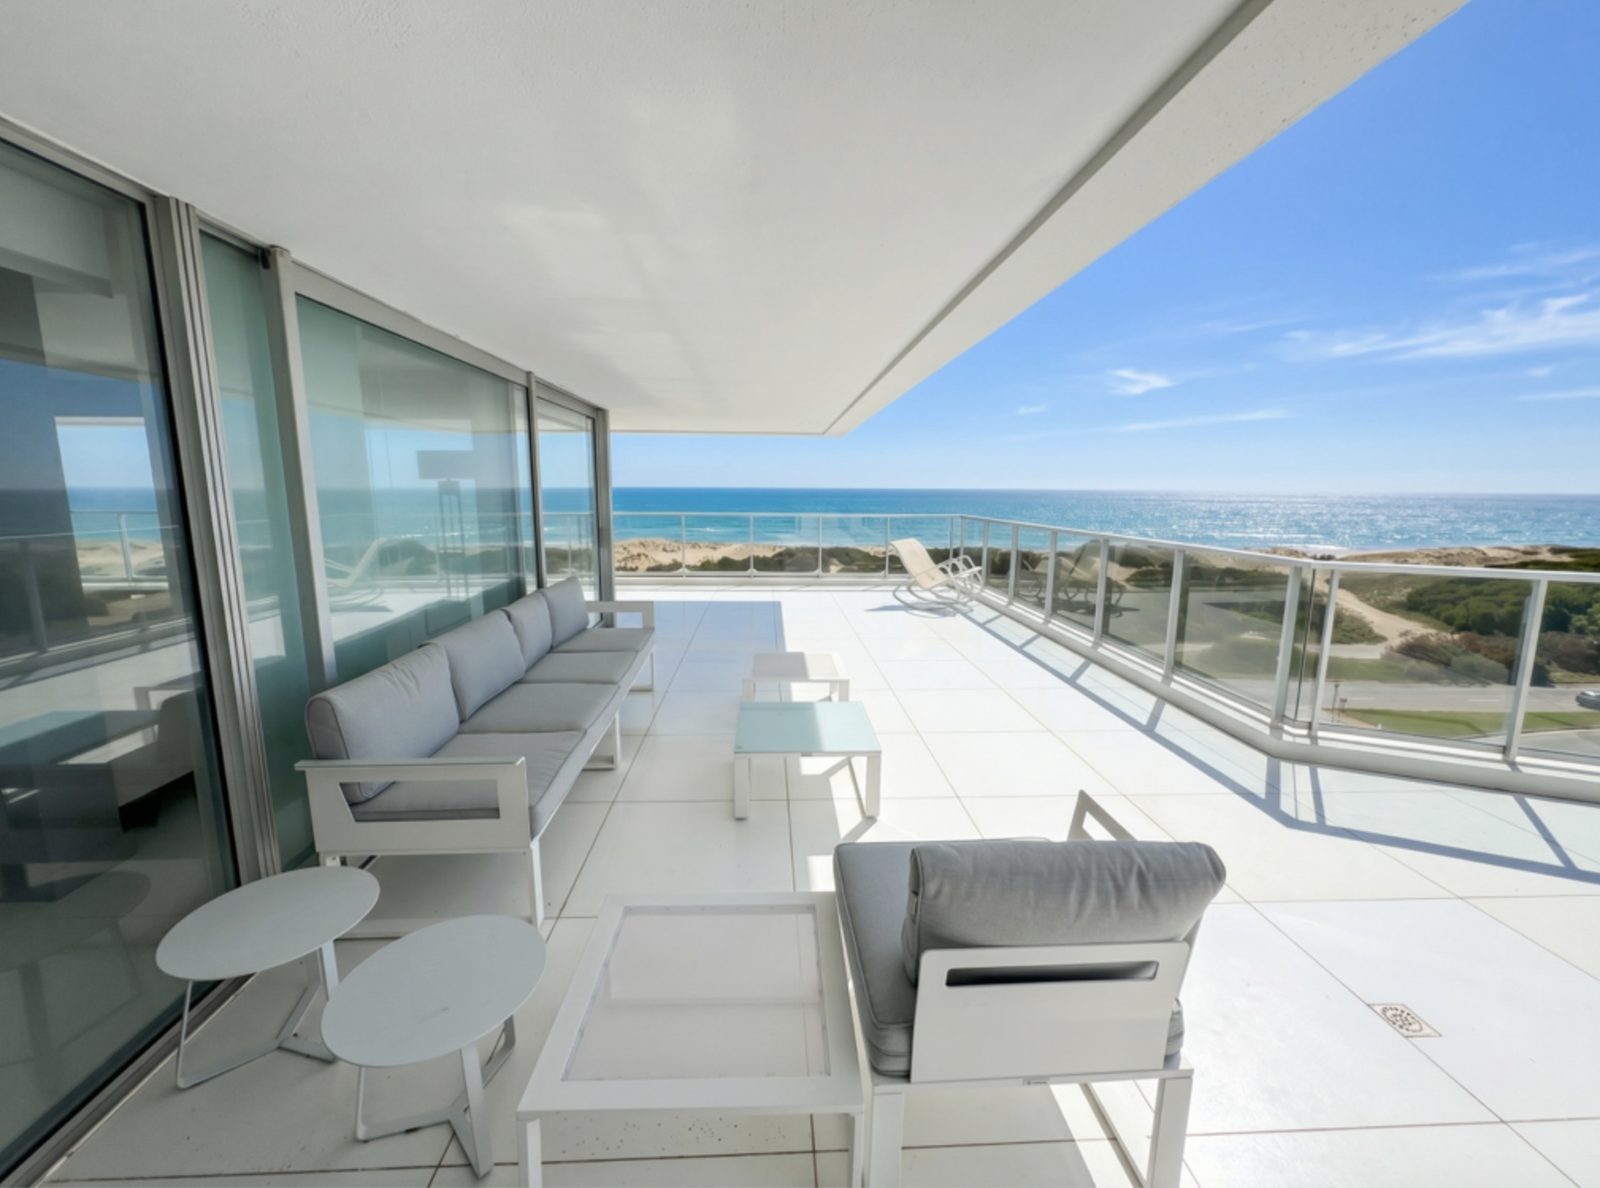
Playa Mansa
Apartments
| Subzone | Notices | Average price | Central range | USD/m² average | 1 bd | 2 bd | 3 bd |
|---|---|---|---|---|---|---|---|
| The whole area | 7.665 | USD 365.000 | 240.000 – 595.000 | USD 3.800/m² | 182.000 | 330.000 | 550.000 |
| Roosevelt | 1.396 | USD 240.000 | 175.000 – 305.000 | USD 3.100/m² | 173.000 | 250.000 | 320.000 |
| Aidy Grill | 1.232 | USD 290.000 | 210.000 – 371.000 | USD 3.650/m² | 195.000 | 290.000 | 395.000 |
| Pinares | 180 | USD 457.000 | 300.000 – 652.500 | USD 3.300/m² | 177.500 | 405.000 | 585.000 |
| Paradas 1–10 | 179 | USD 485.000 | 299.000 – 842.500 | USD 4.100/m² | 163.500 | 410.000 | 695.000 |
| Paradas 11–20 | 101 | USD 450.000 | 278.500 – 1.100.000 | USD 3.900/m² | 157.000 | 339.500 | 890.000 |
| Paradas 31+ | 31 | USD 400.000 | 260.000 – 602.500 | USD 3.300/m² | 205.000 | 375.500 | 640.000 |
| Paradas 21–30 | 21 | USD 379.000 | 310.000 – 530.000 | USD 4.600/m² | — | 335.000 | 540.000 |
Houses
| Subzone | Notices | Average price | Central range | USD/m² average |
|---|---|---|---|---|
| The whole area | 1.401 | USD 690.000 | 425.000 – 1.050.000 | USD 2.450/m² |
| Pinares | 361 | USD 395.000 | 305.000 – 572.000 | USD 2.350/m² |
| Marly | 71 | USD 495.000 | 390.000 – 690.000 | USD 2.300/m² |
| Aidy Grill | 40 | USD 597.500 | 500.000 – 690.000 | USD 4.050/m² |
| Las Delicias | 30 | USD 405.000 | 340.000 – 539.500 | USD 2.050/m² |
| Roosevelt | 28 | USD 670.000 | 369.000 – 900.000 | USD 2.400/m² |
| Paradas 11–20 | 19 | USD 780.000 | 580.000 – 915.000 | USD 2.200/m² |
| Paradas 1–10 | 16 | USD 794.500 | 587.500 – 1.510.000 | USD 2.800/m² |
| Paradas 31+ | 9 | USD 1.180.000 | 575.000 – 1.200.000 | — |
Please note: these figures are only averages. There are options for every taste, at lower and higher values, and the price varies a lot depending on the area; in the case of buildings, one tower right next to another can be worth more than double depending on the year built and the amenities.
Playa Brava
Apartments
| Subzone | Notices | Average price | Central range | USD/m² average | 1 bd | 2 bd | 3 bd |
|---|---|---|---|---|---|---|---|
| The whole area | 6.524 | USD 480.000 | 305.000 – 850.000 | USD 4.050/m² | 215.000 | 345.000 | 690.000 |
| Rincón del Indio | 444 | USD 570.000 | 395.000 – 1.271.500 | USD 4.450/m² | 355.000 | 399.500 | 700.000 |
| San Rafael | 291 | USD 248.000 | 189.500 – 474.500 | USD 3.500/m² | 185.000 | 278.000 | 540.000 |
| Paradas 1–10 | 171 | USD 440.000 | 279.500 – 780.000 | USD 3.600/m² | 210.000 | 328.000 | 725.000 |
| Chiverta | 156 | USD 340.000 | 268.000 – 449.000 | USD 3.450/m² | 215.000 | 297.500 | 462.500 |
| La Pastora | 124 | USD 294.000 | 222.000 – 435.000 | USD 3.850/m² | 190.000 | 285.000 | 482.500 |
| Paradas 21+ | 38 | USD 628.000 | 432.500 – 945.000 | USD 4.000/m² | — | 425.000 | 850.000 |
| El Golf | 21 | USD 315.000 | 179.000 – 520.000 | USD 2.850/m² | 179.000 | 317.500 | — |
| Paradas 11–20 | 11 | USD 750.000 | 465.000 – 3.375.000 | USD 5.600/m² | — | — | — |
Houses
| Subzone | Notices | Average price | Central range | USD/m² average |
|---|---|---|---|---|
| The whole area | 635 | USD 920.000 | 649.000 – 1.600.000 | USD 2.850/m² |
| San Rafael | 217 | USD 790.000 | 580.000 – 1.100.000 | USD 2.550/m² |
| El Golf | 175 | USD 1.400.000 | 985.000 – 1.965.000 | USD 2.900/m² |
| Rincón del Indio | 161 | USD 790.000 | 590.000 – 1.200.000 | USD 2.950/m² |
| La Pastora | 8 | USD 372.500 | 266.000 – 450.000 | — |
Please note: these figures are only averages. There are options for every taste, at lower and higher values, and the price varies a lot depending on the area; in the case of buildings, one tower right next to another can be worth more than double depending on the year built and the amenities.
Península
Apartments
| Subzone | Notices | Average price | Central range | USD/m² average | 1 bd | 2 bd | 3 bd |
|---|---|---|---|---|---|---|---|
| The whole area | 2.946 | USD 280.000 | 190.000 – 460.000 | USD 3.500/m² | 165.000 | 250.000 | 410.000 |
Houses
| Subzone | Notices | Average price | Central range | USD/m² average |
|---|---|---|---|---|
| The whole area | 132 | USD 1.160.000 | 857.500 – 1.500.000 | USD 3.300/m² |
Please note: these figures are only averages. There are options for every taste, at lower and higher values, and the price varies a lot depending on the area; in the case of buildings, one tower right next to another can be worth more than double depending on the year built and the amenities.
Punta Ballena
Apartments
| Subzone | Notices | Average price | Central range | USD/m² average | 1 bd | 2 bd | 3 bd |
|---|---|---|---|---|---|---|---|
| The whole area | 903 | USD 265.000 | 170.000 – 430.000 | USD 3.700/m² | 196.000 | 355.000 | 690.000 |
| Solanas | 165 | USD 198.000 | 146.000 – 280.000 | USD 3.500/m² | 200.000 | 335.000 | 362.500 |
| Las Grutas | 82 | USD 165.000 | 129.000 – 225.000 | USD 3.550/m² | 163.500 | 265.000 | — |
| Lomo de la Ballena | 62 | USD 403.000 | 250.000 – 584.000 | USD 3.300/m² | 320.000 | 420.000 | 780.000 |
| Rinconada | 11 | USD 290.000 | 285.000 – 357.500 | USD 2.150/m² | — | 287.500 | — |
| Laguna del Diario | 11 | USD 550.000 | 460.000 – 650.000 | USD 3.400/m² | — | — | 600.000 |
Houses
| Subzone | Notices | Average price | Central range | USD/m² average |
|---|---|---|---|---|
| The whole area | 841 | USD 480.000 | 320.000 – 820.000 | USD 2.600/m² |
| Solanas | 163 | USD 540.000 | 440.000 – 792.500 | USD 2.750/m² |
| Tío Tom | 80 | USD 495.000 | 337.000 – 690.000 | USD 2.700/m² |
| Club del Lago | 61 | USD 390.000 | 295.000 – 500.000 | USD 2.400/m² |
| Ocean Park | 58 | USD 175.000 | 140.500 – 287.000 | USD 2.050/m² |
| Portezuelo | 55 | USD 350.000 | 185.000 – 450.000 | USD 2.000/m² |
| Las Grutas | 47 | USD 409.000 | 322.000 – 680.000 | USD 2.600/m² |
| Laguna del Sauce | 46 | USD 535.000 | 284.000 – 980.000 | USD 2.850/m² |
| Chihuahua | 36 | USD 365.000 | 260.000 – 596.000 | USD 2.500/m² |
| Laguna de los Cisnes | 21 | USD 895.000 | 750.000 – 1.900.000 | USD 3.550/m² |
| Rinconada | 12 | USD 850.000 | 647.500 – 1.322.500 | USD 3.700/m² |
| Lomo de la Ballena | 12 | USD 2.000.000 | 1.500.000 – 2.450.000 | USD 4.250/m² |
| Laguna del Diario | 12 | USD 870.000 | 475.000 – 1.112.500 | USD 2.350/m² |
Please note: these figures are only averages. There are options for every taste, at lower and higher values, and the price varies a lot depending on the area; in the case of buildings, one tower right next to another can be worth more than double depending on the year built and the amenities.
La Barra
Apartments
| Subzone | Notices | Average price | Central range | USD/m² average | 1 bd | 2 bd | 3 bd |
|---|---|---|---|---|---|---|---|
| The whole area | 719 | USD 500.000 | 336.500 – 980.000 | USD 4.500/m² | 201.500 | 346.500 | 740.000 |
| Montoya | 141 | USD 550.000 | 420.000 – 740.000 | USD 5.000/m² | 193.000 | 440.000 | 680.000 |
| Bikini | 19 | USD 650.000 | 515.000 – 800.000 | USD 5.150/m² | — | 560.000 | 850.000 |
Houses
| Subzone | Notices | Average price | Central range | USD/m² average |
|---|---|---|---|---|
| The whole area | 1.442 | USD 650.000 | 380.000 – 1.050.000 | USD 3.000/m² |
| Montoya | 380 | USD 780.000 | 550.000 – 1.200.000 | USD 3.150/m² |
| Balneario Buenos Aires | 170 | USD 242.500 | 165.000 – 310.000 | USD 2.000/m² |
| El Tesoro | 97 | USD 275.000 | 225.000 – 350.000 | USD 2.300/m² |
| El Quijote | 60 | USD 670.000 | 594.000 – 829.000 | USD 2.400/m² |
| Puerto Quetzal | 41 | USD 1.350.000 | 1.250.000 – 2.490.000 | USD 4.050/m² |
| Barra Verde | 16 | USD 460.000 | 329.000 – 520.000 | USD 3.700/m² |
| Camino Eguzquiza | 11 | USD 850.000 | 665.000 – 1.200.000 | USD 2.500/m² |
Please note: these figures are only averages. There are options for every taste, at lower and higher values, and the price varies a lot depending on the area; in the case of buildings, one tower right next to another can be worth more than double depending on the year built and the amenities.
Manantiales
Apartments
| Subzone | Notices | Average price | Central range | USD/m² average | 1 bd | 2 bd | 3 bd |
|---|---|---|---|---|---|---|---|
| The whole area | 663 | USD 740.000 | 410.000 – 1.220.000 | USD 5.850/m² | 175.000 | 580.000 | 975.000 |
| Bikini | 84 | USD 710.000 | 404.000 – 1.212.500 | USD 6.650/m² | 390.000 | 560.000 | 1.200.000 |
Houses
| Subzone | Notices | Average price | Central range | USD/m² average |
|---|---|---|---|---|
| The whole area | 485 | USD 900.000 | 510.000 – 1.450.000 | USD 3.650/m² |
| El Chorro | 80 | USD 790.000 | 350.000 – 1.102.500 | USD 3.600/m² |
| Punta Piedras | 76 | USD 920.000 | 435.000 – 1.900.000 | USD 3.150/m² |
| Pueblo Mío | 52 | USD 1.295.000 | 1.100.000 – 1.522.500 | USD 4.400/m² |
| Laguna Blanca | 45 | USD 1.200.000 | 920.000 – 1.350.000 | USD 3.650/m² |
| Bikini | 8 | USD 625.000 | 517.500 – 750.000 | USD 3.900/m² |
Please note: these figures are only averages. There are options for every taste, at lower and higher values, and the price varies a lot depending on the area; in the case of buildings, one tower right next to another can be worth more than double depending on the year built and the amenities.
José Ignacio
Apartments
| Subzone | Notices | Average price | Central range | USD/m² average | 1 bd | 2 bd | 3 bd |
|---|---|---|---|---|---|---|---|
| The whole area | 86 | USD 585.000 | 309.000 – 744.000 | USD 5.850/m² | 175.000 | 590.000 | 790.000 |
| La Juanita | 32 | USD 562.500 | 324.000 – 650.000 | USD 4.650/m² | 175.000 | 590.000 | 750.000 |
Houses
| Subzone | Notices | Average price | Central range | USD/m² average |
|---|---|---|---|---|
| The whole area | 752 | USD 1.000.000 | 450.000 – 1.800.000 | USD 3.950/m² |
| Pinar del Faro | 126 | USD 1.400.000 | 1.200.000 – 1.630.000 | USD 4.500/m² |
| Santa Mónica | 115 | USD 300.000 | 175.500 – 790.000 | USD 2.700/m² |
| La Juanita | 101 | USD 480.000 | 350.000 – 750.000 | USD 3.050/m² |
| Arenas de José Ignacio | 63 | USD 625.000 | 383.000 – 885.000 | USD 3.000/m² |
| Laguna Escondida | 59 | USD 1.900.000 | 1.500.000 – 2.500.000 | USD 5.100/m² |
| San Vicente | 48 | USD 477.500 | 439.000 – 700.000 | USD 2.700/m² |
| Club de Mar | 20 | USD 3.825.000 | 2.975.000 – 6.000.000 | USD 12.950/m² |
| Village del Faro | 19 | USD 2.200.000 | 2.150.000 – 2.750.000 | USD 6.000/m² |
Please note: these figures are only averages. There are options for every taste, at lower and higher values, and the price varies a lot depending on the area; in the case of buildings, one tower right next to another can be worth more than double depending on the year built and the amenities.
Inland neighborhoods
Apartments
| Subzone | Notices | Average price | Central range | USD/m² average | 1 bd | 2 bd | 3 bd |
|---|---|---|---|---|---|---|---|
| The whole area | 290 | USD 240.000 | 172.000 – 298.000 | USD 3.250/m² | 167.000 | 250.000 | 310.000 |
| Cantegril | 192 | USD 220.000 | 167.000 – 280.000 | USD 3.100/m² | 160.000 | 245.500 | 299.000 |
| Lugano | 32 | USD 258.500 | 224.000 – 366.000 | USD 3.650/m² | 220.000 | 259.000 | 365.000 |
| Barrio Córdoba | 26 | USD 327.000 | 238.500 – 601.500 | USD 3.700/m² | 226.500 | 327.000 | — |
| Arcobaleno | 20 | USD 255.000 | 133.000 – 301.000 | USD 3.000/m² | — | 235.000 | 295.000 |
| Beverly Hills | 14 | USD 251.000 | 167.500 – 355.500 | USD 3.150/m² | 159.500 | — | — |
Houses
| Subzone | Notices | Average price | Central range | USD/m² average |
|---|---|---|---|---|
| The whole area | 484 | USD 750.000 | 529.000 – 978.000 | USD 2.350/m² |
| Cantegril | 195 | USD 680.000 | 420.000 – 851.000 | USD 2.300/m² |
| Lugano | 174 | USD 800.000 | 700.000 – 986.000 | USD 2.350/m² |
| Barrio Córdoba | 58 | USD 480.000 | 376.000 – 597.500 | USD 2.350/m² |
| Beverly Hills | 57 | USD 1.280.000 | 860.000 – 2.200.000 | USD 2.550/m² |
Please note: these figures are only averages. There are options for every taste, at lower and higher values, and the price varies a lot depending on the area; in the case of buildings, one tower right next to another can be worth more than double depending on the year built and the amenities.
These are asking (listed) prices, not closing prices. On the portals, the same property is often listed by several agencies and on both sites at once: each combination of price, square meters, and bedrooms within the area was counted only once. Subzones with fewer than 8 listings are not shown. Source: public listings from MercadoLibre and InfoCasas, surveyed on September 7, 2026 by Santiago Pereyra Propiedades.
How to read these numbers
Average price: the zone's median value —half the properties cost less and the other half more—, which represents the market better than the arithmetic mean because an exceptional property doesn't skew it. Central range: between 25 % and 75 % of values, i.e. where most of the supply sits. USD/m²: average price per square meter of properties with recorded floor area. Only zones and subzones with at least 8 listings are shown; these are asking prices, not closing prices, and do not include notary fees or commission.
Please note: these figures are only averages. There are options for every taste, at lower and higher values, and the price varies a lot depending on the area; in the case of buildings, one tower right next to another can be worth more than double depending on the year built and the amenities.
For the details of each area — beach, services, which type of property predominates — there are the neighborhood guides; for the costs of buying (ITP, notary, commission), the guide to buying in Uruguay; and for what actually sells in each area and at what price, how much it costs to buy in each area.
Frequently asked questions
How much does an apartment in Punta del Este cost in 2026?
As of September 2026, the average asking price for apartments for sale in Punta del Este ranges from USD 240.000 in inner neighborhoods to USD 740.000 in Manantiales, depending on the area. These are only averages: many properties are above and below.
Are these closing prices or asking prices?
These are asking prices: the values at which properties for sale in Punta del Este and surrounding areas are listed. The closing price is usually below the asking price, by a margin that varies depending on the property and market conditions at the time. And they're only averages: many properties are above and below each figure.
How is the USD price per square meter calculated?
By dividing the listed price by the declared surface area of each property and taking the median value for the area; only properties with a recorded surface area (more than 15 m²) are included, and only areas with at least 6 cases. Using the median value keeps one exceptional property from skewing the average.
How often is this page updated?
The survey of published listings is repeated every month; each table shows the date of the last survey (7 September 2026).
How much does a 1-bedroom apartment cost in Punta del Este?
According to sale listings published on real estate portals as of September 7, 2026, the average price of a 1-bedroom apartment is: Península USD 165.000; Barrios interiores USD 167.000; Manantiales USD 175.000; José Ignacio USD 175.000; Playa Mansa USD 182.000; Punta Ballena USD 196.000; La Barra USD 201.500; Playa Brava USD 215.000. These are asking prices and only an average: many properties are above and below these values.
How much does a 2-bedroom apartment cost in Punta del Este?
According to the sales listings published on real estate portals as of September 7, 2026, the average price for a 2-bedroom apartment is: Península USD 250.000; Inland neighborhoods USD 250.000; Playa Mansa USD 330.000; Playa Brava USD 345.000; La Barra USD 346.500; Punta Ballena USD 355.000; Manantiales USD 580.000; José Ignacio USD 590.000. These are asking prices and only an average: many properties are above and below these values.
How much does a 3-bedroom apartment cost in Punta del Este?
According to the sales listings published on real estate portals as of September 7, 2026, the average price for a 3-bedroom apartment is: Inland neighborhoods USD 310.000; Península USD 410.000; Playa Mansa USD 550.000; Playa Brava USD 690.000; Punta Ballena USD 690.000; La Barra USD 740.000; José Ignacio USD 790.000; Manantiales USD 975.000. These are asking prices and only an average: many properties are above and below these values.
How much does a house cost in Punta del Este, La Barra or José Ignacio?
Average price of houses listed for sale as of September 7, 2026: Punta Ballena USD 480.000; La Barra USD 650.000; Playa Mansa USD 690.000; Inland neighborhoods USD 750.000; Manantiales USD 900.000; Playa Brava USD 920.000; José Ignacio USD 1.000.000; Península USD 1.160.000. This is only an average: in every area there are many houses above and below it, even at half or double that value.
Guide me through buying I want to know how much mine is worth