The price per m² in Punta del Este stands, as of September 2026, at a general average close to USD 3.200, with ranges from USD 2.500–2.800 in the inland neighborhoods and subsidized housing to USD 10.000+ in José Ignacio. This report ranks the reference values by zone, the real sale timeframes and the typical negotiation margin.
The ranges correspond to apartments and are market reference values as of September 2026. For the qualitative profile of each neighborhood (who rents there, what product works) check the guide to the best areas to invest in.
How much the m² costs in each zone of Punta del Este
Reference values by area, ranked from highest to lowest:
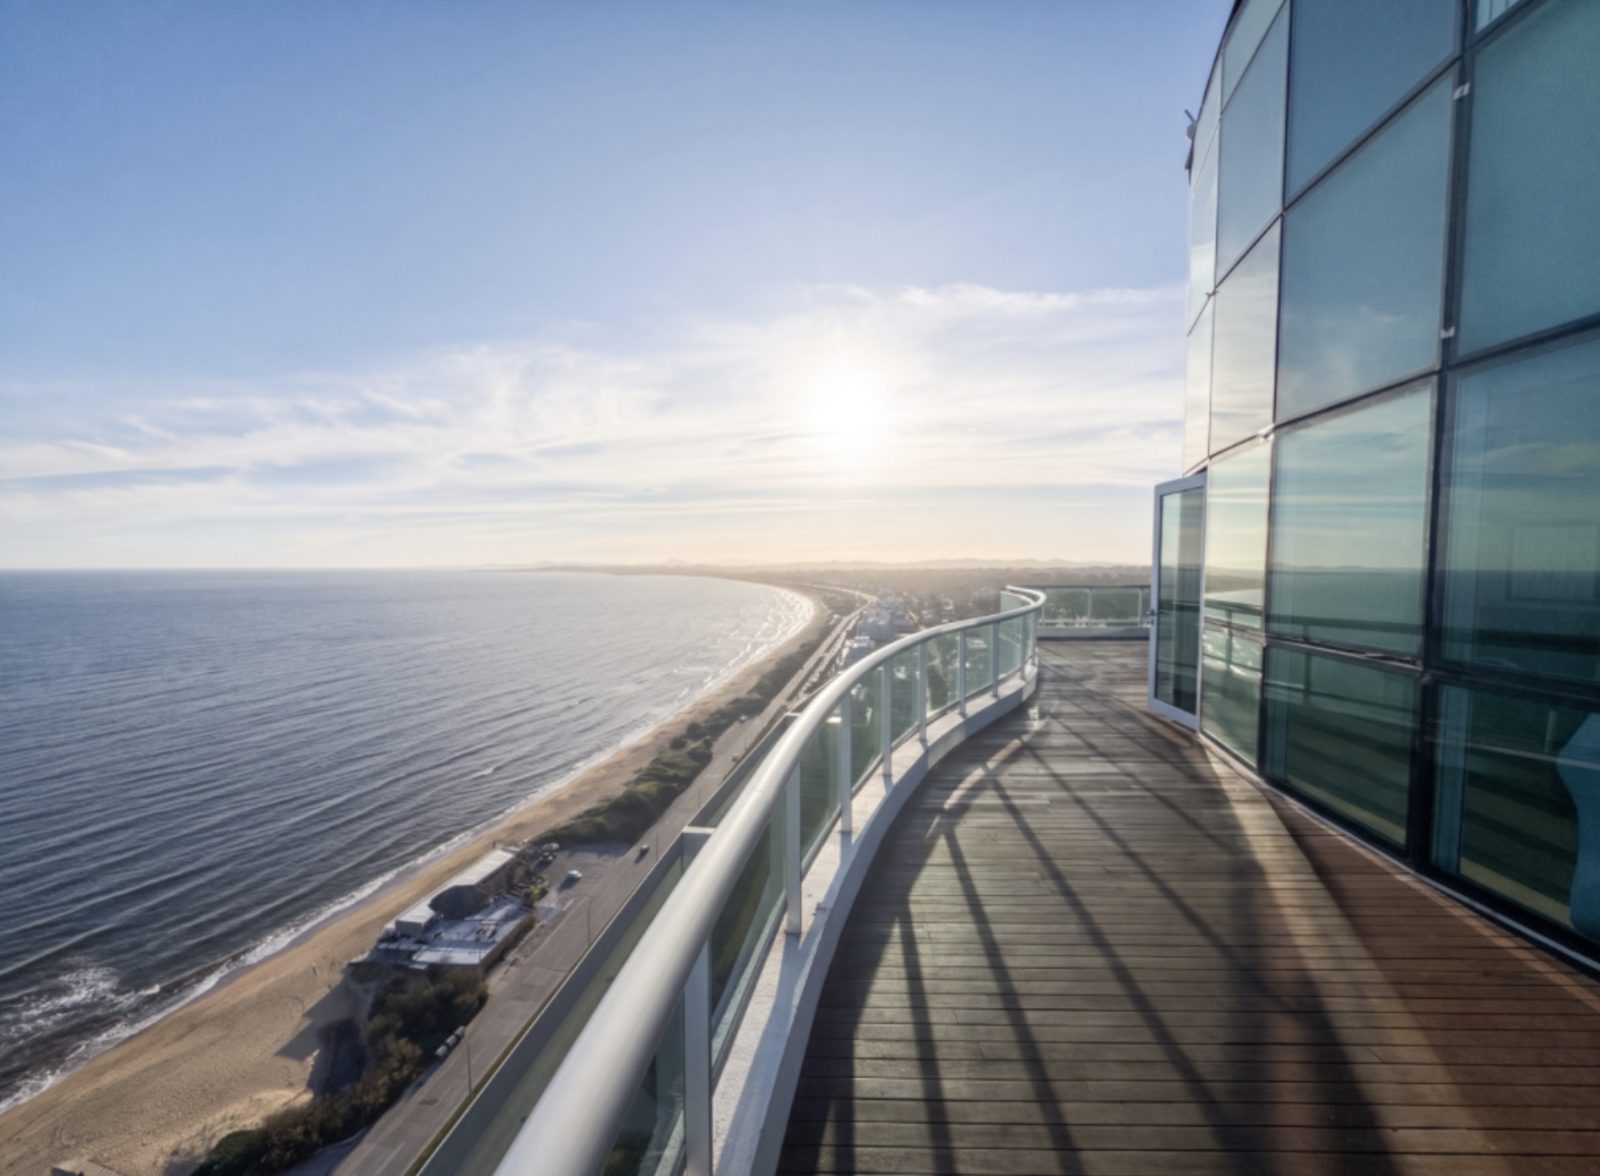
- José Ignacio: USD 6.000–10.000+ per m². The top of the market, with scarce supply and international demand.
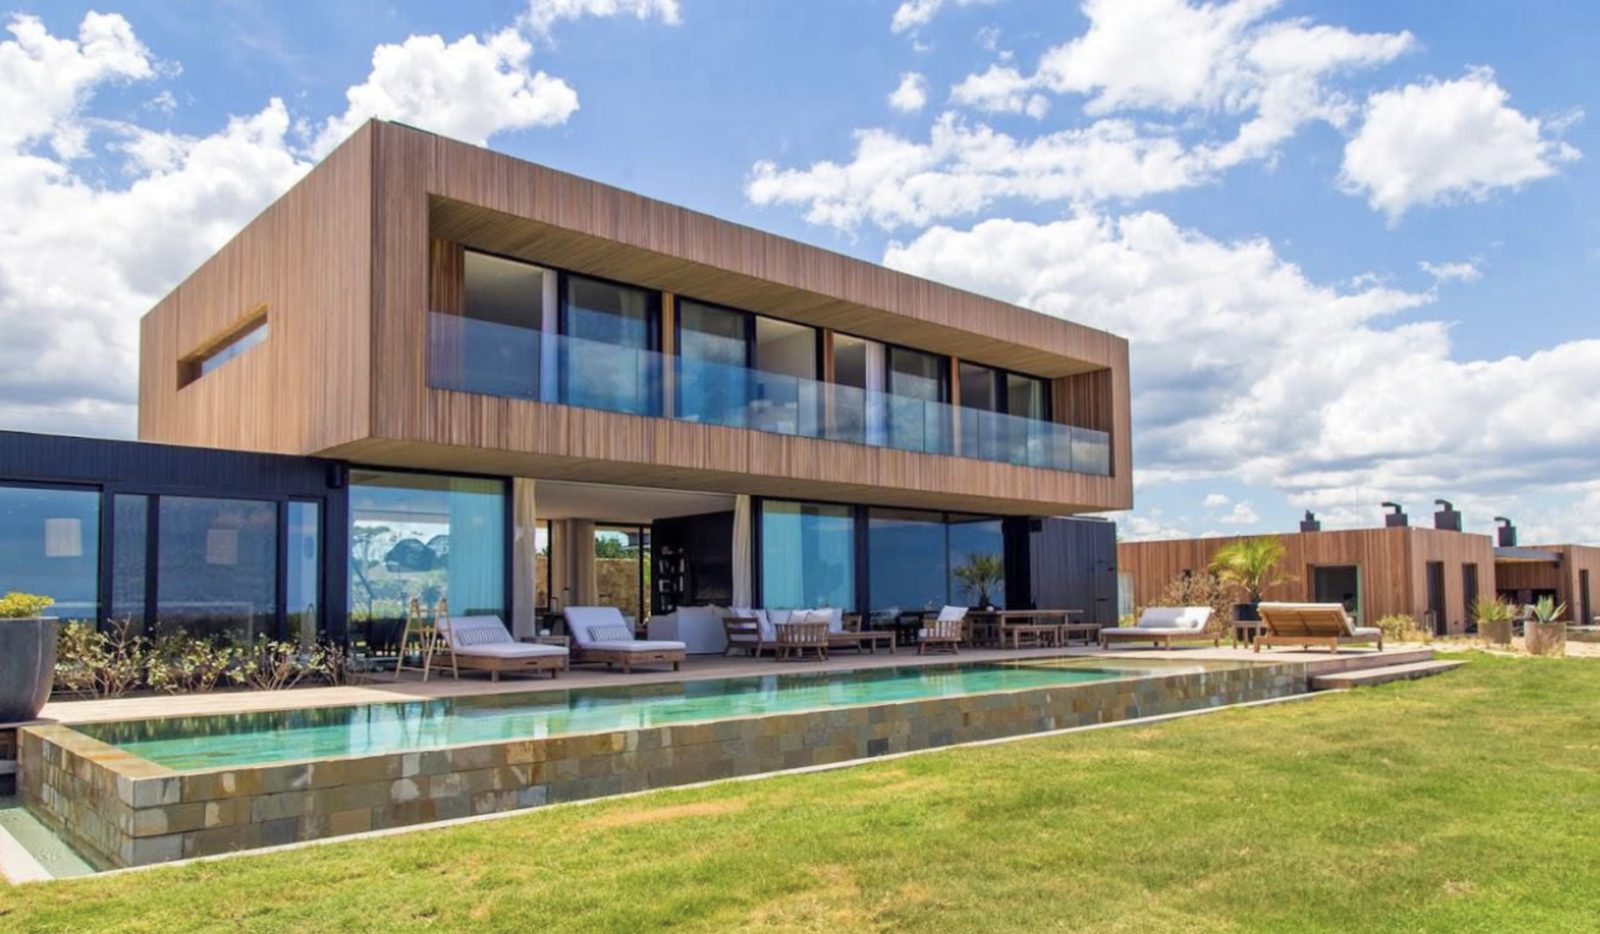
- La Barra and Manantiales: USD 4.500–9.000. The area with the strongest recent appreciation: La Barra rose between 10% and 15% from 2022 to 2025.
- Playa Brava: USD 4.000–7.000. Concentrates the new construction with amenities and the most intense seasonal demand.
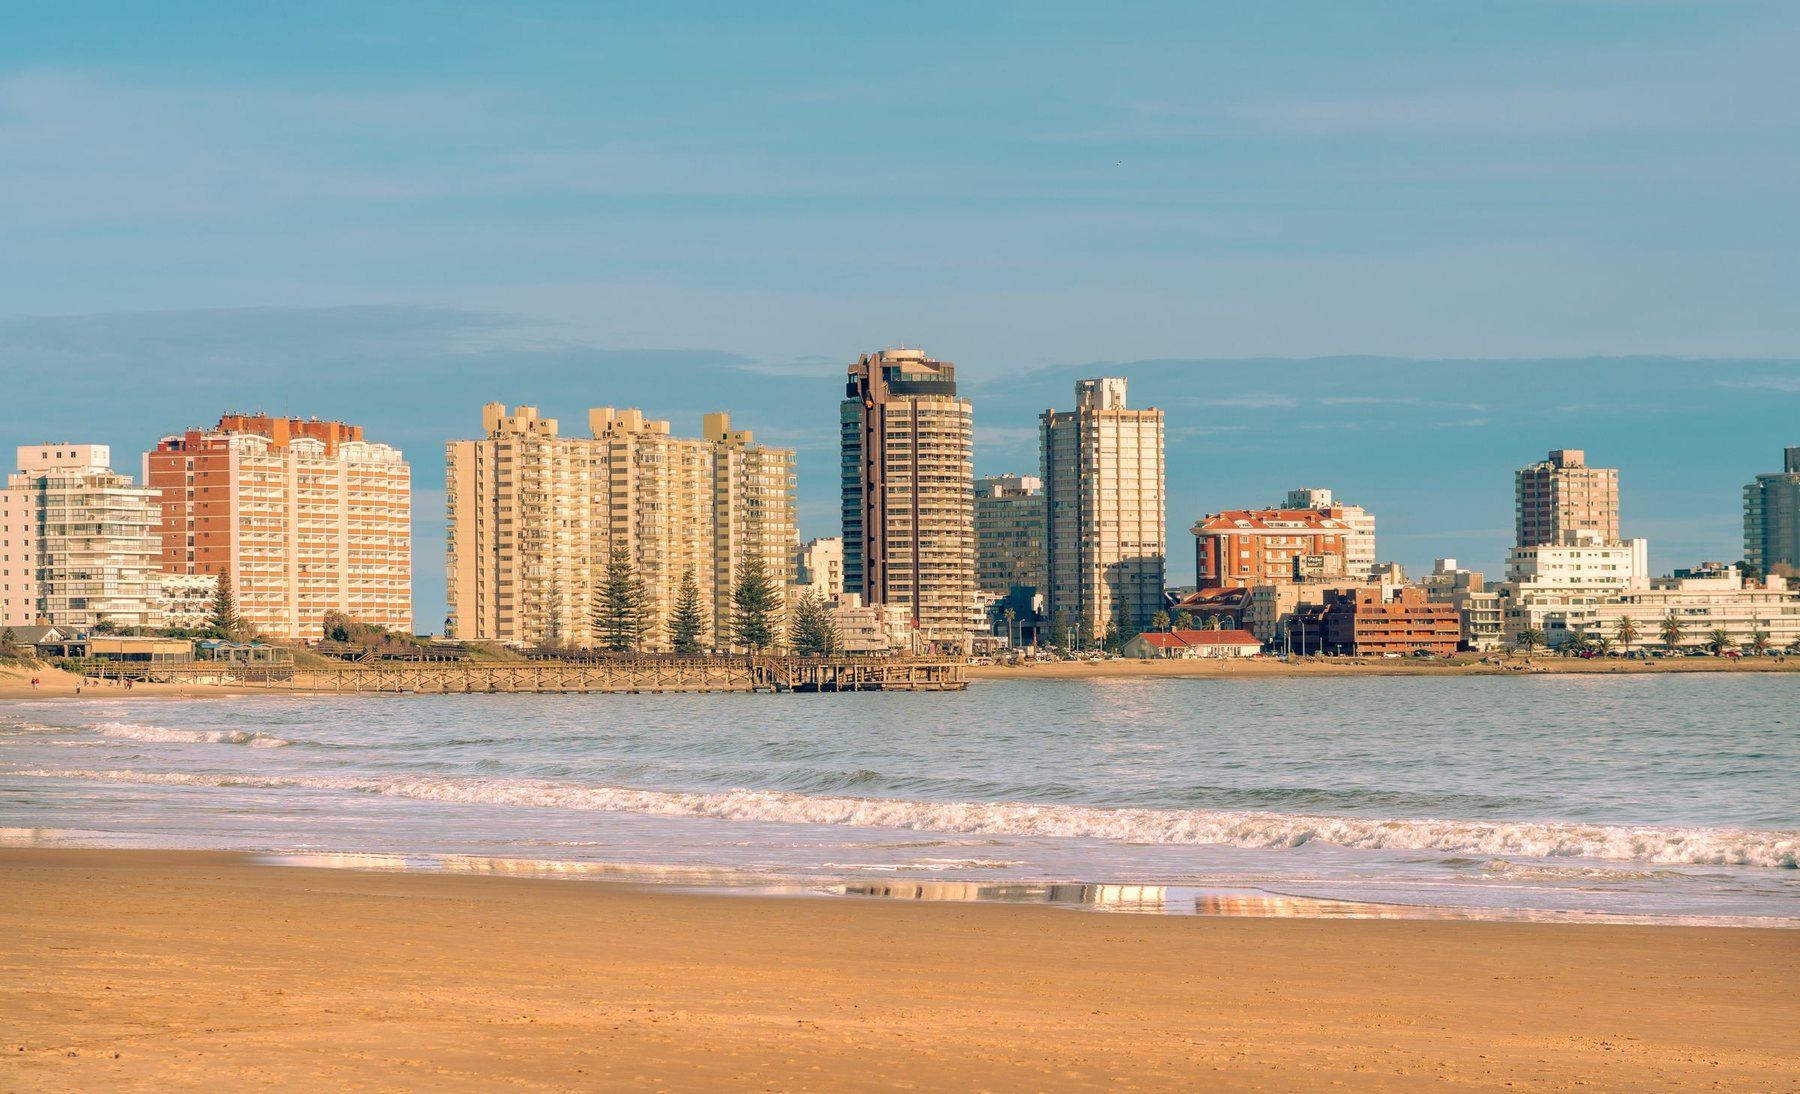
- Playa Mansa: USD 3.500–6.500. Beachfront towers with stock consolidated by bus stop.
- Península: USD 3.500–6.000. The services hub, year-round.
- Roosevelt: USD 2.800–4.500. The hub for year-round living: services all year, direct access and the most reasonable entry prices on the east side.
- Promoted housing: USD 2.500–4.500. Projects with tax exemptions, generally off-plan.
| Zone | USD / m² | What defines it |
|---|---|---|
| José Ignacio | 6.000–10.000+ | Top of the market: scarce product and international demand |
| La Barra and Manantiales | 4.500–9.000 | The biggest recent appreciation: La Barra rose 10–15% between 2022 and 2025 |
| Playa Brava | 4.000–7.000 | Concentrates new construction with amenities and the most intense summer-season demand |
| Playa Mansa | 3.500–6.500 | Beachfront towers and consolidated inventory by bus stop |
| Península | 3.500–6.000 | The year-round service hub |
| Roosevelt | 2.800–4.500 | The year-round housing corridor with the most reasonable entry prices |
| Promoted housing | 2.500–4.500 | Projects with tax exemptions, generally off-plan |
Contrast with listed inventory (September 2026). The average USD/m² of apartments listed for sale on real estate portals is: Playa Mansa USD 3.800/m²; Playa Brava USD 4.050/m²; Península USD 3.500/m²; Punta Ballena USD 3.700/m²; La Barra USD 4.500/m²; Manantiales USD 5.850/m²; José Ignacio USD 5.850/m². These are asking prices across the whole market, not closing prices, which is why they fall below the ranges in the table, which describe the product that actually sells in each area. The breakdown by subzone, houses and bedrooms, updated every month, is on the prices by zone page.
Note: these values are only averages. Many properties fall above and below these figures, depending on the exact area, the building, the size, the view and the condition.
How we build these figures. These are Santiago Pereyra Propiedades' own estimates, built from real transactions in our portfolio and daily tracking of listings published in Punta del Este and Maldonado. They don't come from an official index: Uruguay has no public record of closing prices by zone. They are reviewed every quarter.
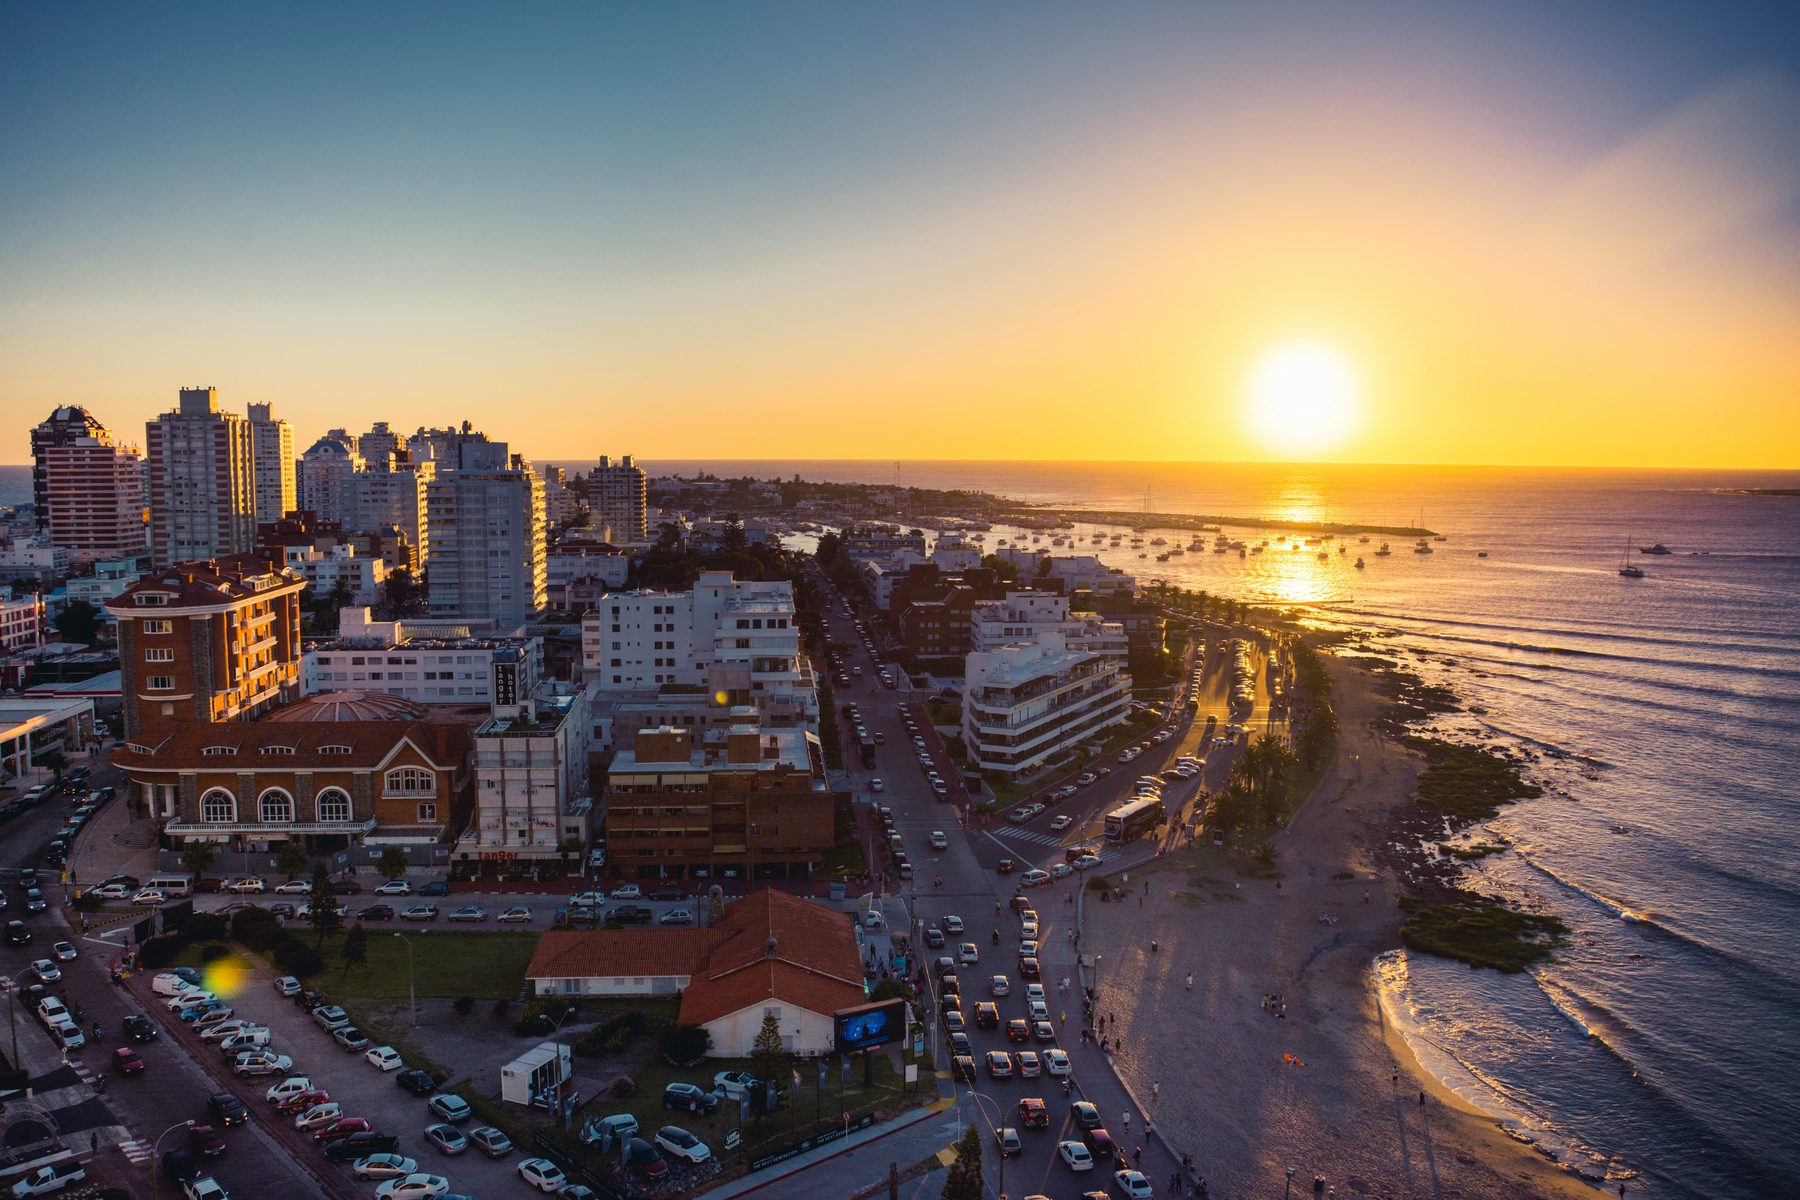
The price per m² in Punta del Este is a benchmark, not a list price
An honest warning before using the table: in Punta del Este, price per m² works as a guideline, not a rule. Within the same area, towers and developments coexist with per-m² values that nearly double those of the building next door. A brand-new, first-line tower with full amenities can trade at double the m² price of a forty-year-old building three blocks away, in the same neighborhood and on the same reference table.
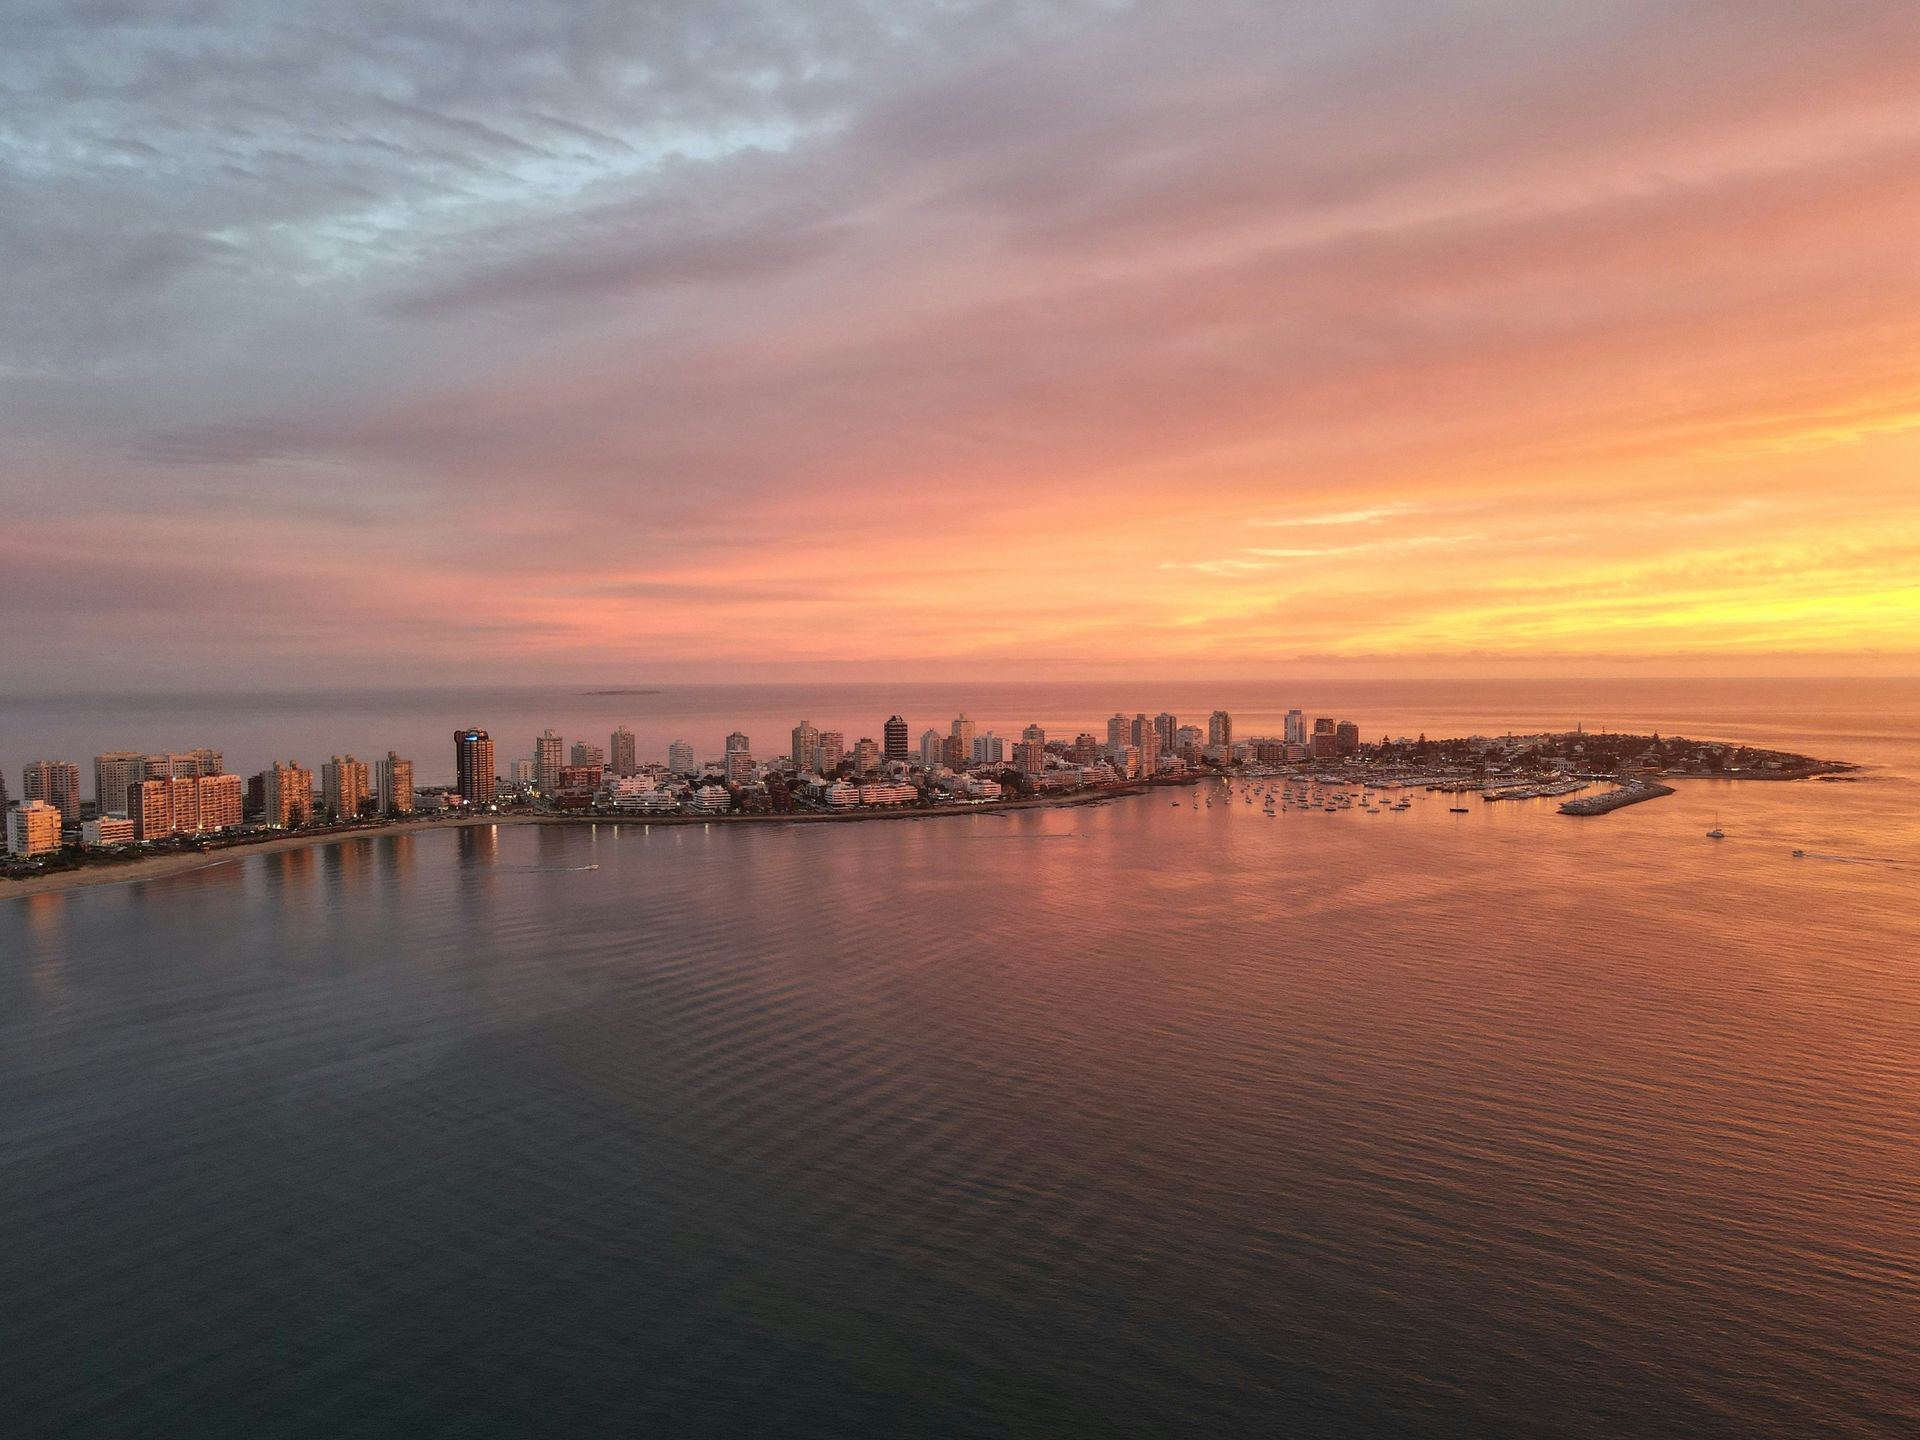
What places a unit higher or lower within the range
The variables that matter most, in this order: the line relative to the sea —beachfront with an open view versus the back row—, the building's brand and age (premium new construction versus decades-old stock), height and orientation, the amenities package and the parking space. The same neighborhood can have units at the floor of the range and others that break well above it: that's why the value of a specific property is set with comparables from its own building and block, not the area average. In the building directory you can see how the product changes block by block.
USD PER M² · APARTMENTS · REF. SEPTEMBER 2026
Apartment ranges by area. Reference values September 2026.
How long it takes to sell a property and how much room there is to negotiate
The listed price is half the story; the other half is the timeline. Reference figures:
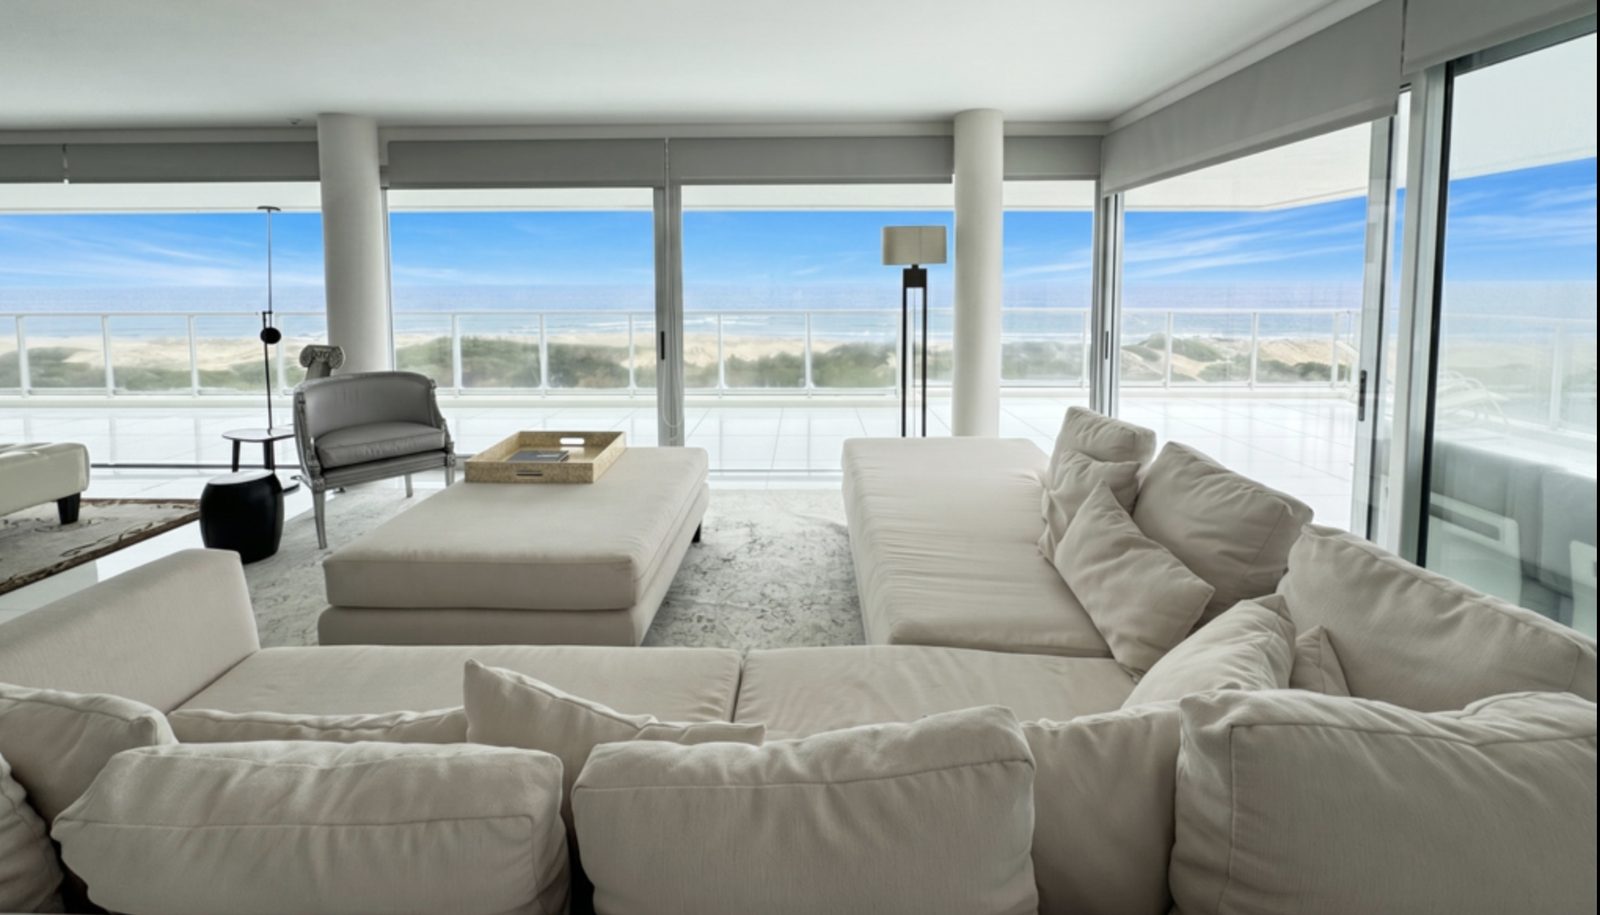
- Apartments: 120 to 140 days on the market on average.
- Houses: around 170 days.
- Well-priced properties in year-round-demand areas: 90 days or less.
- Poorly priced properties: more than 200 days, with the listing losing appeal.
- Negotiation: deals close between 6% and 10% below the listed price, depending on the type of property.
The takeaway is straightforward: an accurate appraisal cuts the time to sell by more than half. The mechanism is well known too: a property listed too high loses its best weeks of exposure, racks up days on the market, and ends up negotiating down more than that reference range. One listed at the right price gets viewings from day one and closes close to the asking price. If you're on the seller's side, the method is in our guide on how to set your sale price, and you can request a professional appraisal of your property.
How to use this data if you're buying
For the buyer, the ranges work as a reality check in both directions. An offer well below the area's floor deserves questions (condition, occupancy, title) before enthusiasm. And a listed price above the ceiling isn't necessarily a “no”: with 120 to 140 days of average time on market and a typical negotiation of 6% to 10%, there's room to talk, especially for properties listed for several months. The data frames the conversation; the visit and the comparables settle it.
What's moving prices in 2026
Three underlying forces sustain the values:
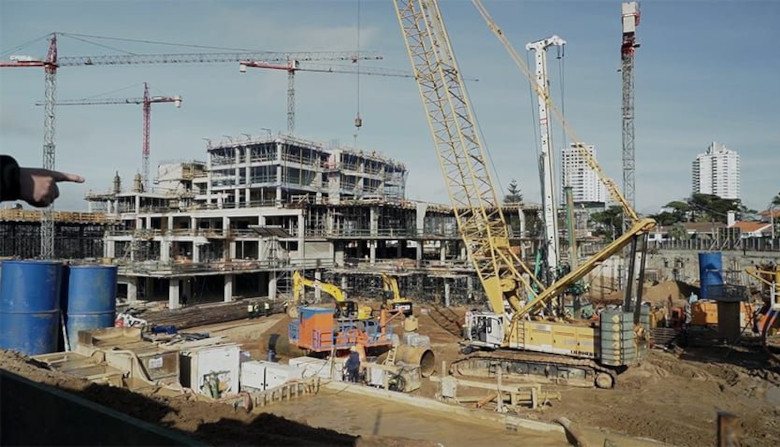
- New construction at record volume: more than 70 active developments in 2026, with 5,5 million m² filed over seven years and accumulated investment of over USD 12.000 million. The full pipeline can be seen in towers and developments.
- Mixed, sustained demand: Uruguayan buyers carry more and more weight and keep demand steady year-round, while Argentine demand has moderated and remains concentrated in the high end of the summer season. Brazilians and Europeans add to the mix, with a growing presence in new construction.
- Seasons that validate the rental income: 2025/26 was a record, with around 110.000 beds and more than 90% booked in January. That expected rental income is what underpins purchase values, as we show in the guide to investing in Punta del Este.
We'll give you real comparables for the area and the building, with closing values and not just listing prices.
How much the m² of construction costs (and why it's a different thing)
It's worth not confusing the price per m² of a finished unit with the cost per m² of building. They're two different markets. Along the coast, building happens at two levels, and these are turnkey values as of 2026 —construction, social security contributions, fees and permits already included—, without the land:
- Mid-range finish: USD 1.300–1.800 per m². The modern standard: lightened slab, aluminum openings, correct finishes without frills.
- Premium finish: USD 1.800–2.800 per m². Reinforced concrete, double-glazed windows, high-end finishes and home automation — the usual standard for Punta del Este's coastal construction.
Those figures already include the architect's fees (7–10%), BPS contributions for labor —the unified construction contribution is 71,8% on wages for the work, 75,8% when there are Caja Profesional contributions— and permits and connections. That's why a 100 m² house with mid-range finishes ends up, turnkey, in the range of USD 130.000–180.000, with a premium one starting well above that. The land is separate, and in premium zones it can be worth more than the construction: you can see real figures in land for sale.
The gap between those USD 1.800–2.800 to build turnkey premium and the USD 4.000–10.000 at which the finished m² sells in the best areas isn't a mistake: it's the price of the land, the location, the project, the amenities and the developer's risk. That gap also explains why buying off-plan at launch price tends to capture appreciation by the time of delivery.
The market in four numbers
THE MARKET IN FOUR FACTS · 2026
USD per m²
below listed price
apartments
active in 2026
Note: these values are only averages. Many properties fall above and below these figures, depending on the exact area, the building, the size, the view and the condition.
One final note for anyone comparing with new construction: off-plan units usually offer a launch price below the completed unit, with staggered payments during construction and, generally, direct financing from the developer in dollars. The difference between that entry price and the delivered unit's value is precisely the investor's expected profit. How to evaluate that path — and its risks — is covered in the guide to buying off-plan in Punta del Este.
Frequently asked questions
What's the average price per m² in Punta del Este?
The market's overall average sits around USD 3.200 per m² as of September 2026. Reference ranges by zone go from USD 2.500 to 4.500 in tax-incentivized housing up to USD 6.000 to 10.000+ in José Ignacio.
How much negotiating room is there on the listed price?
It depends on the type of property: deals typically close between 6% and 10% below the listed price. A property that's well appraised from the start negotiates less and sells considerably faster than one listed above its market value.
How long does it take to sell an apartment in Punta del Este?
Apartments take between 120 and 140 reference days, and houses around 170. Well-priced properties in areas of year-round demand can sell in 90 days or less, while mispriced ones go past 200 days.
Where is the m² most expensive and where is it most affordable?
The top of the market is José Ignacio, with USD 6.000 to 10.000+ per m², followed by La Barra and Manantiales with USD 4.500 to 9.000. The most accessible values are in Roosevelt (USD 2.800 to 4.500) and in promoted housing (USD 2.500 to 4.500).
How much does the m² of construction cost in Uruguay?
At 2026 reference values, and speaking of turnkey pricing —construction, payroll taxes, fees and permits included—: standard finish USD 1.300 to 1.800 per m² and premium finish USD 1.800 to 2.800. These figures include the architect's fees (7 to 10%) and BPS contributions on labor (a unified contribution of 71,8% on wages). A 100 m² house with a standard finish costs around USD 130.000 to 180.000 turnkey, not counting the land.
Why do two buildings in the same area have such different prices per m²?
Because the area's price per m² is a benchmark, not a list price. A brand-new branded tower, on the first line and with full amenities, can sell for nearly double the price per m² of a building several decades old just a few blocks away. Beachfront location, the building's age, the view and the amenities explain the difference.
Sources
- ITP: rates and calculation basis on the real value set by Catastro · DGI
- Notary fees and real estate commission · Cámara Inmobiliaria Uruguaya
- Unified construction contribution (71,8% on wages; 75,8% with contributions to Caja Profesional) · BPS
- Price per m² of housing construction by typology · Sociedad de Arquitectos del Uruguay / INE
This report is updated every month with the listings published on the portals and with real transactions from our portfolio. If you'd like us to notify you when it changes, leave us your WhatsApp.