The best areas to invest in Punta del Este depend on your goal: for seasonal rental, the front line of Playa Brava and La Barra; for year-round rental, the Roosevelt corridor and the inland neighborhoods; for appreciation, La Barra and Manantiales; for personal use with partial rental, the Mansa and the Península. There's no "best area" in the abstract: there's the best area for your strategy.
Neighborhood by neighborhood, with July 2026 values. The overall market figures (rental strategies, entry costs) are in the guide to investing in Punta del Este, and the full price ranges are in the price per m² by zone report.
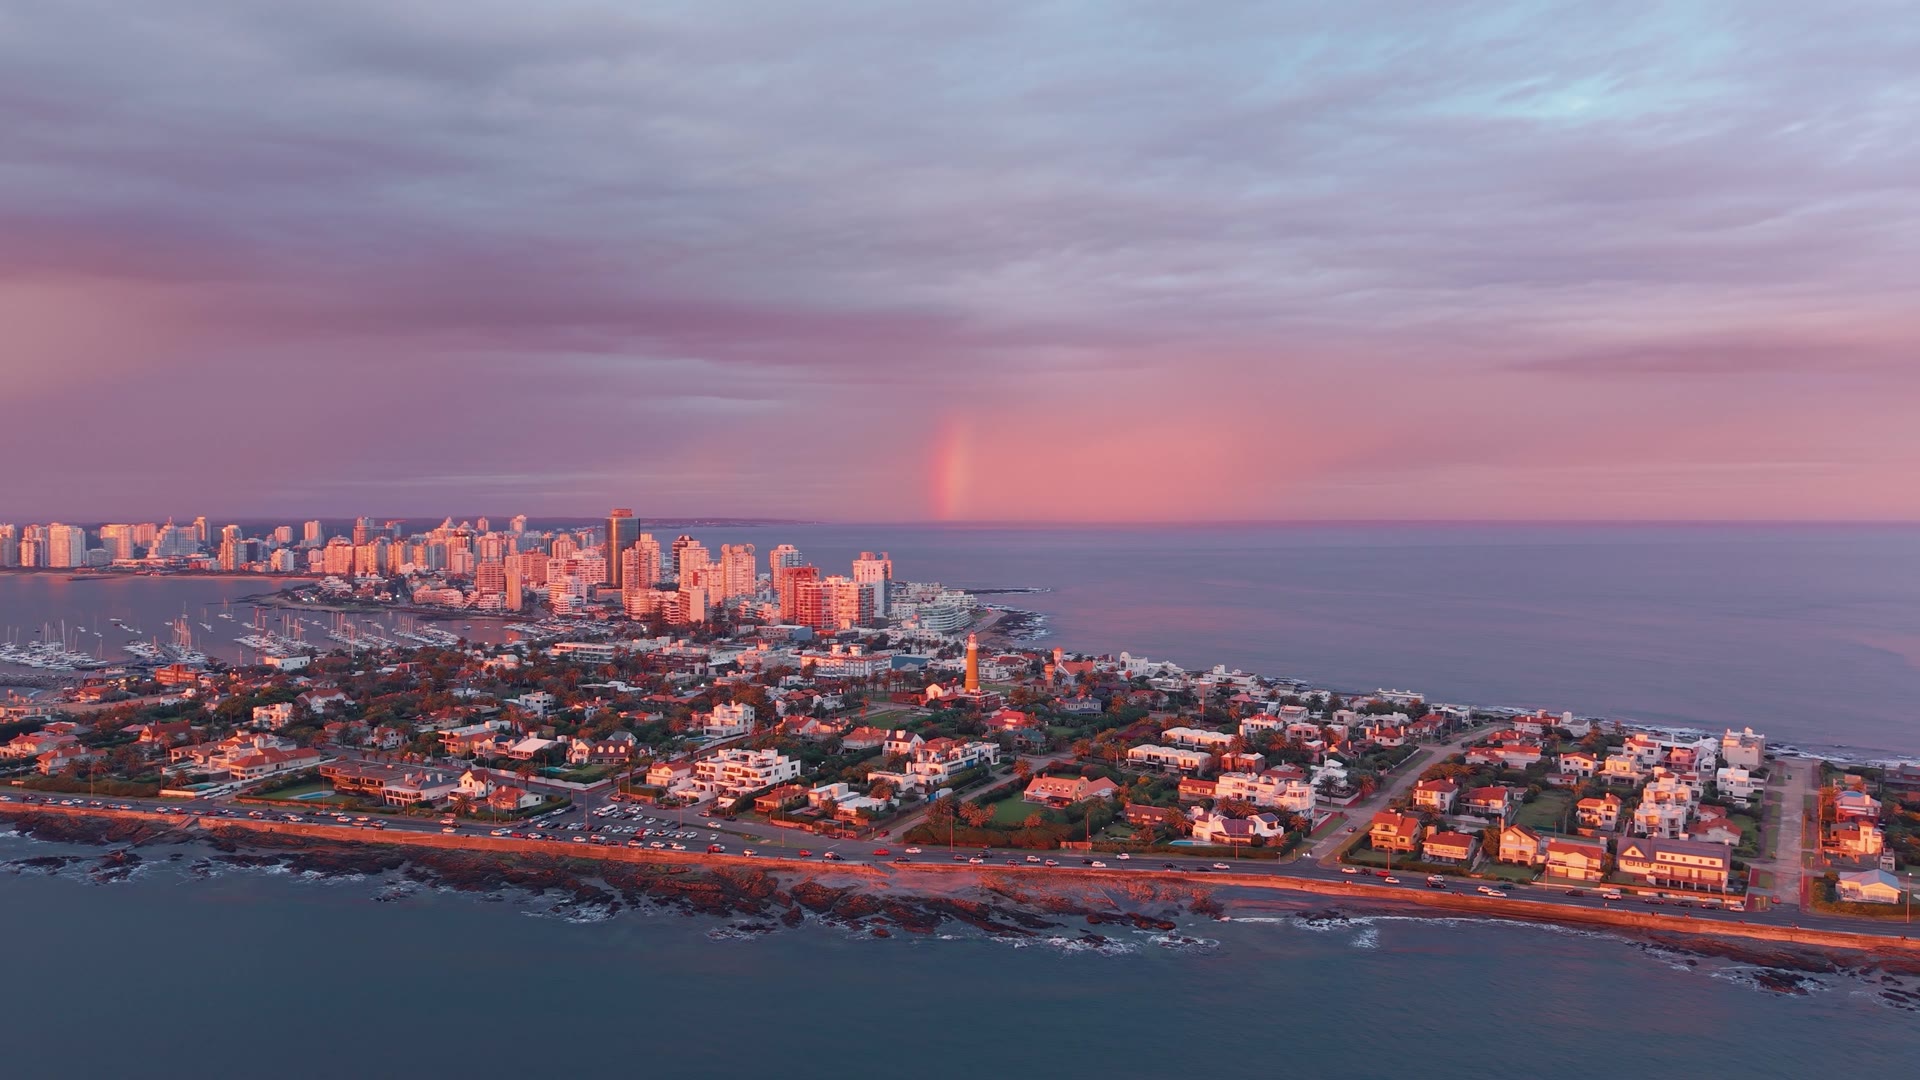
Area by area: what investment profile each neighborhood has
Península: the center that works year-round
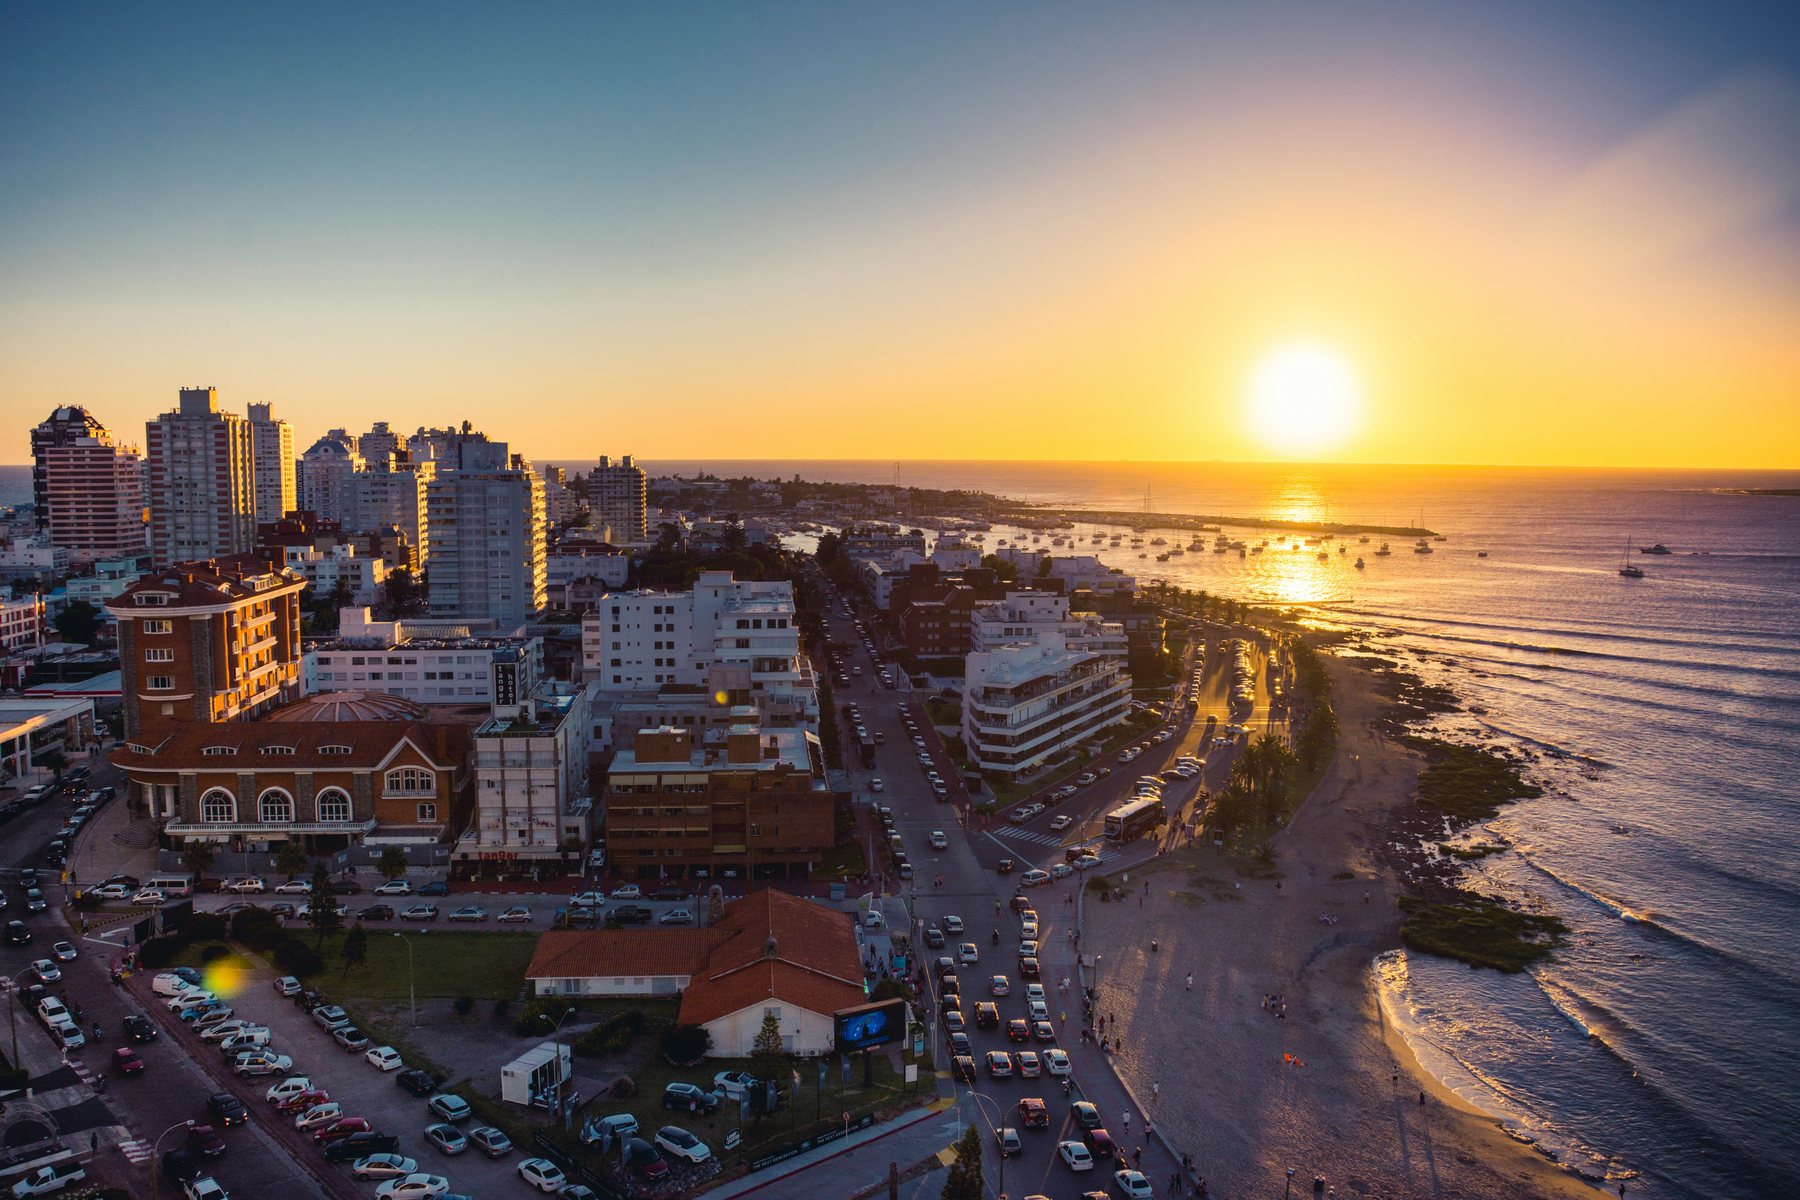
The historic center concentrates the port, dining and services open twelve months a year. With reference values of USD 3.500 to 6.000 per m², it combines strong seasonal rental with year-round demand from those who want to live within walking distance of everything. A good entry point in mid-sized apartments.
Playa Mansa: beachfront towers and a family crowd
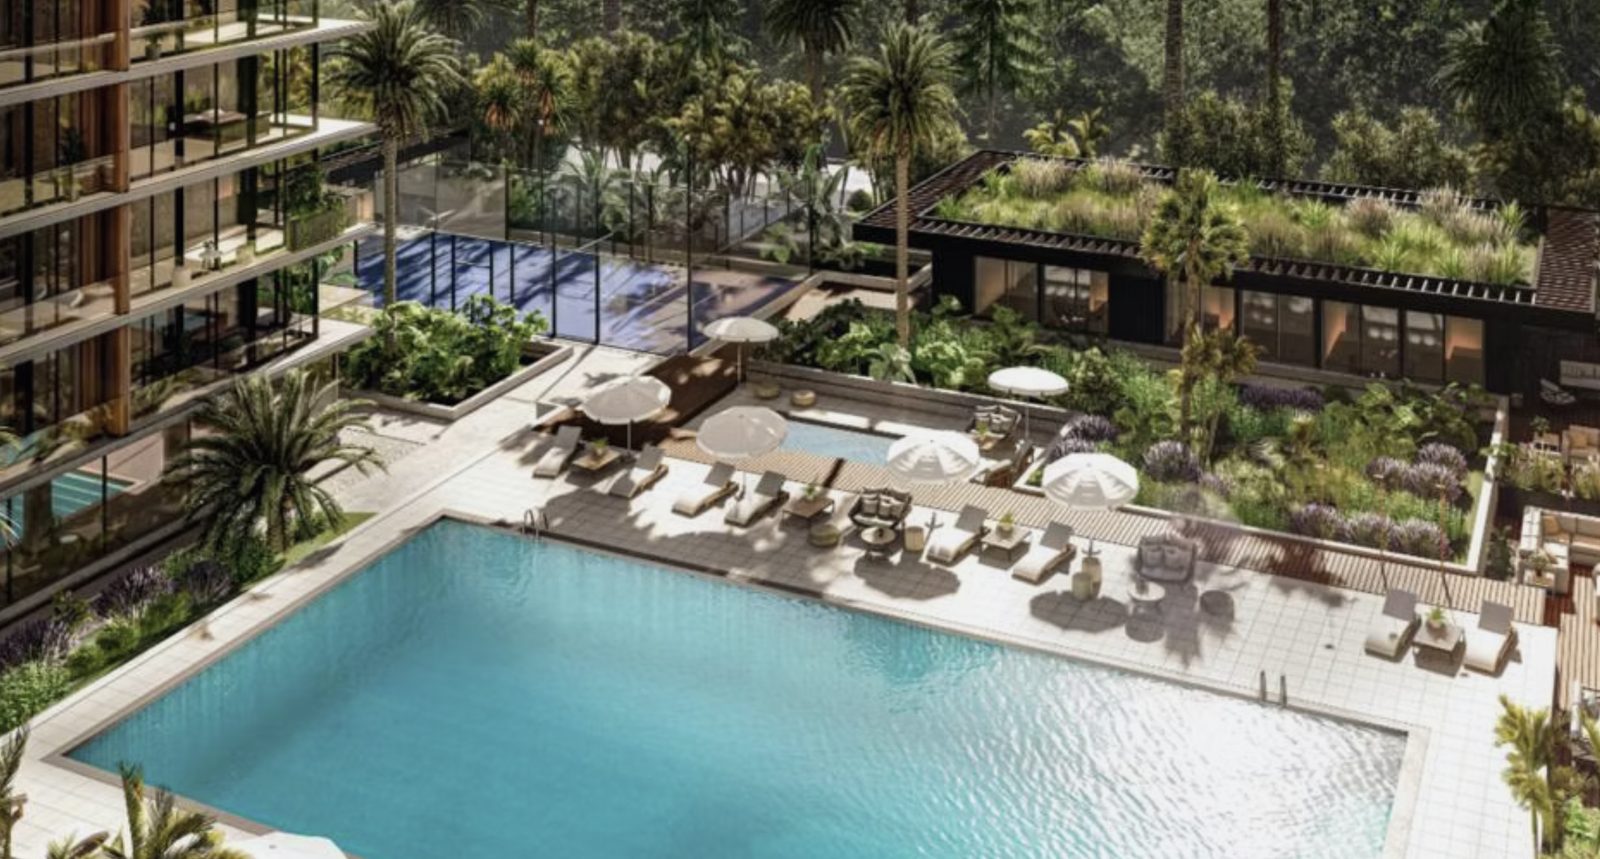
La Mansa is the waterfront of sunsets and families. Prices of USD 3.500 to 6.500 per m², with established buildings and new towers by the Paradas. It works very well for personal use combined with January rental: in season, a well-located 1-bedroom apartment is listed for the 1st half of January between USD 3.500 and 4.500 (summer 2027).
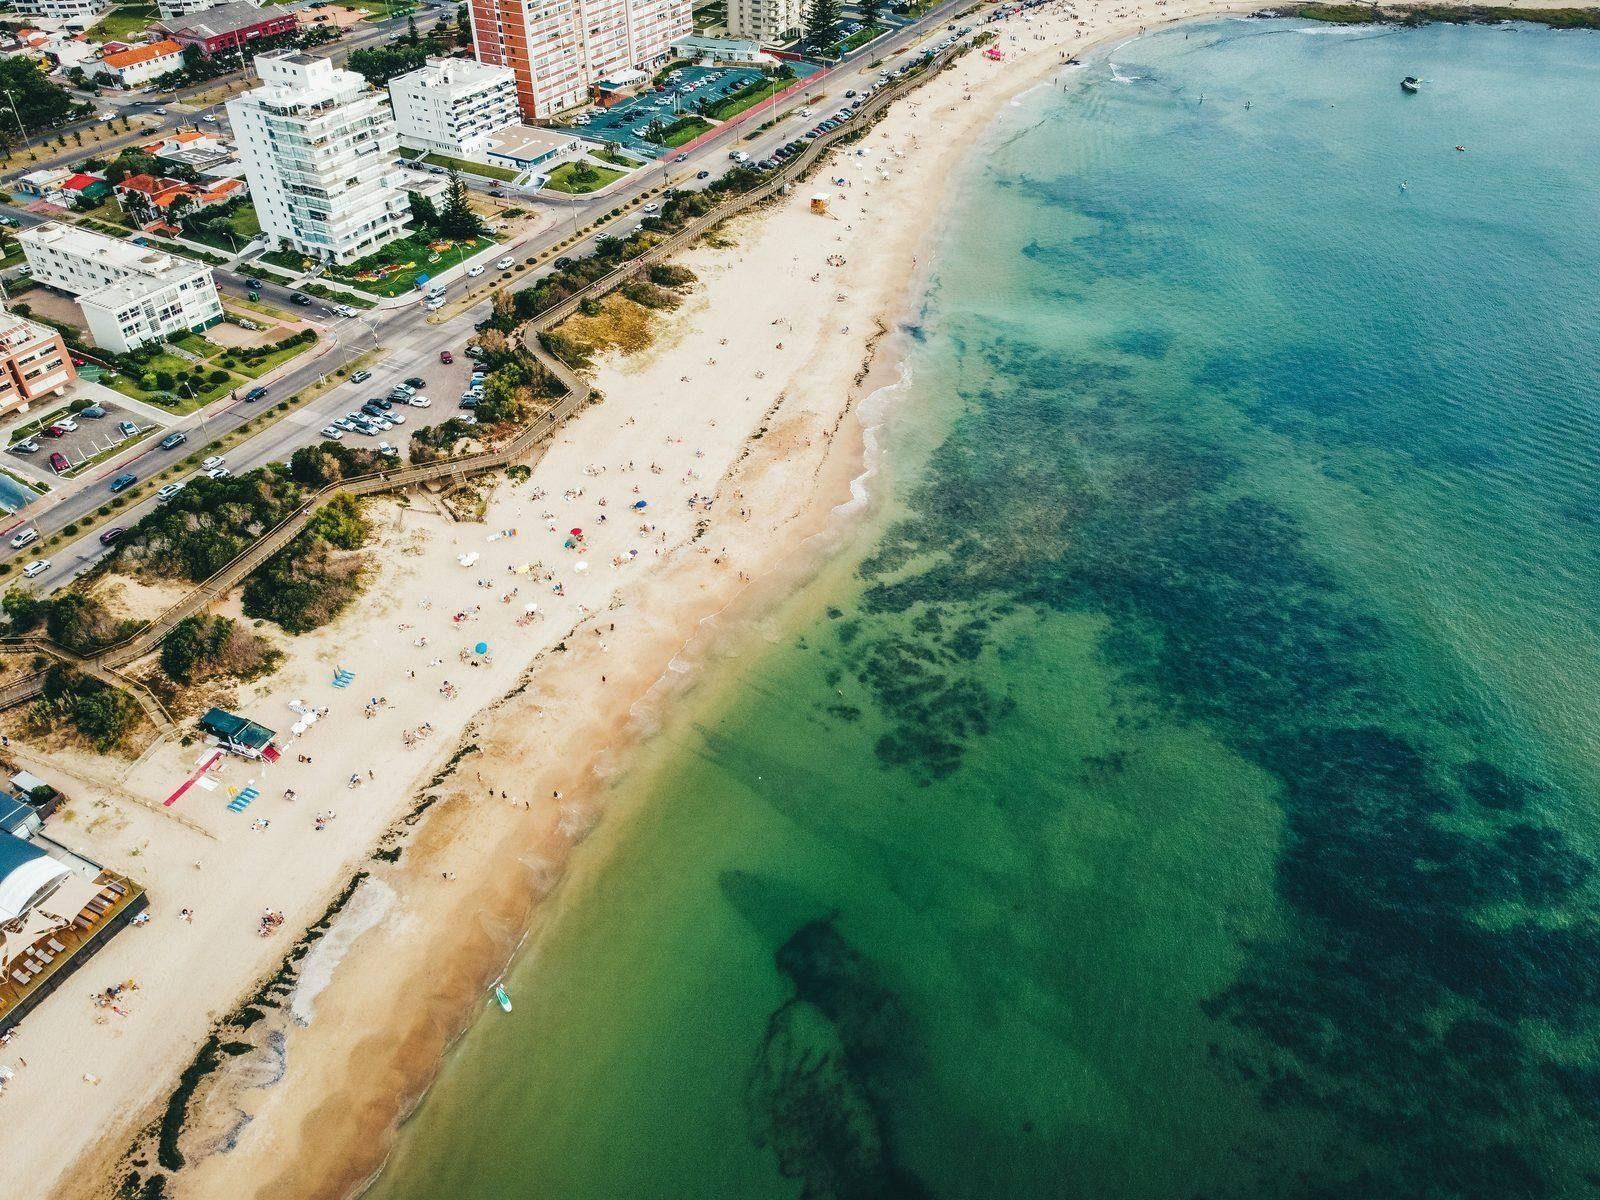
Playa Brava: the heart of seasonal rentals
La Brava holds much of the new construction with amenities right on the open sea. Prices of USD 4.000 to 7.000 per m² and the most intense seasonal demand in the city: the 2025/26 season closed with more than 90% booked for January. It's the natural area for a pure seasonal-rental strategy: in most cases, January's rent covers the whole year's expenses.
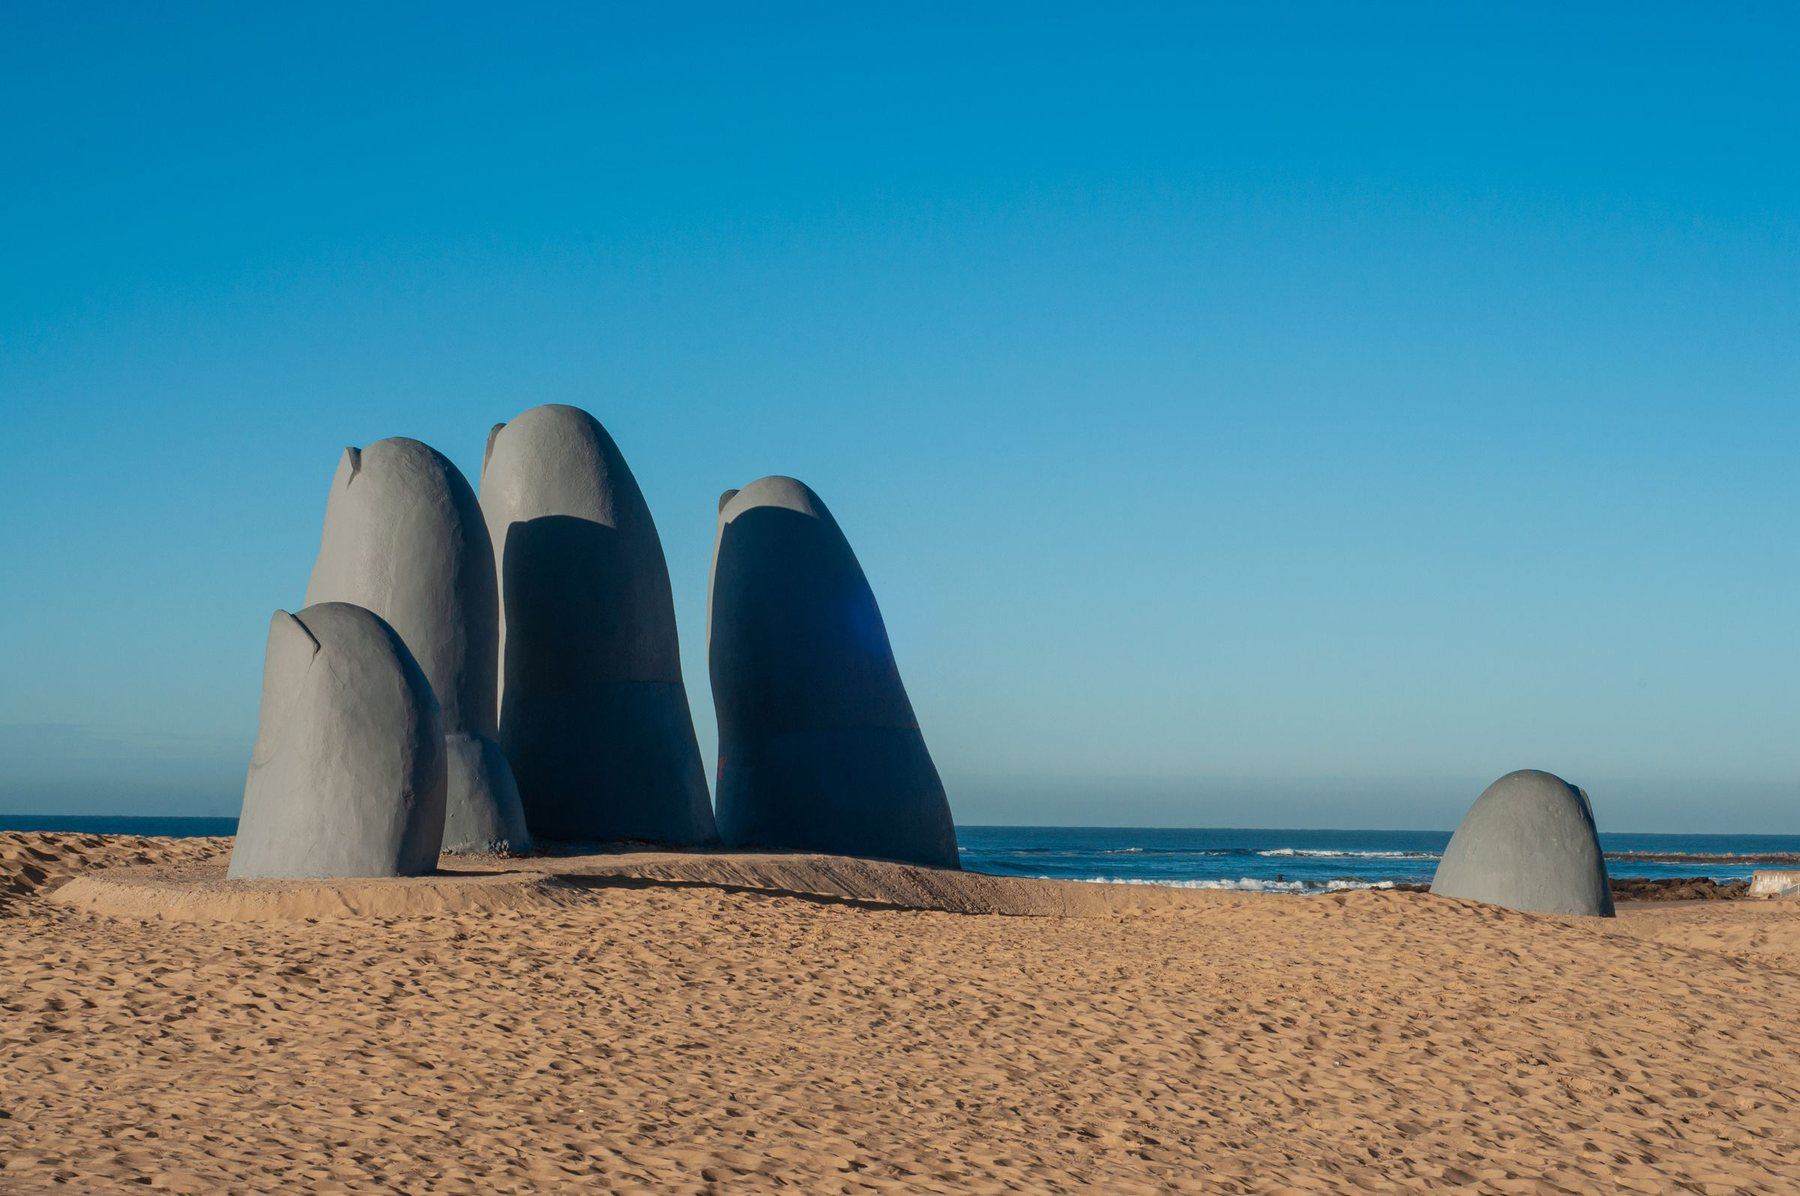
Avenida Roosevelt: the corridor that works all twelve months
It's best not to mix it up with the Brava, because it's a different market. The Avenida Roosevelt corridor has a noticeably lower entry ticket —USD 2.800 to 4.500 per m²— and different demand: permanent housing, year-round services and direct access to both beaches. It's the zone for investors who prefer annual contracts and steady flow over the January peak.
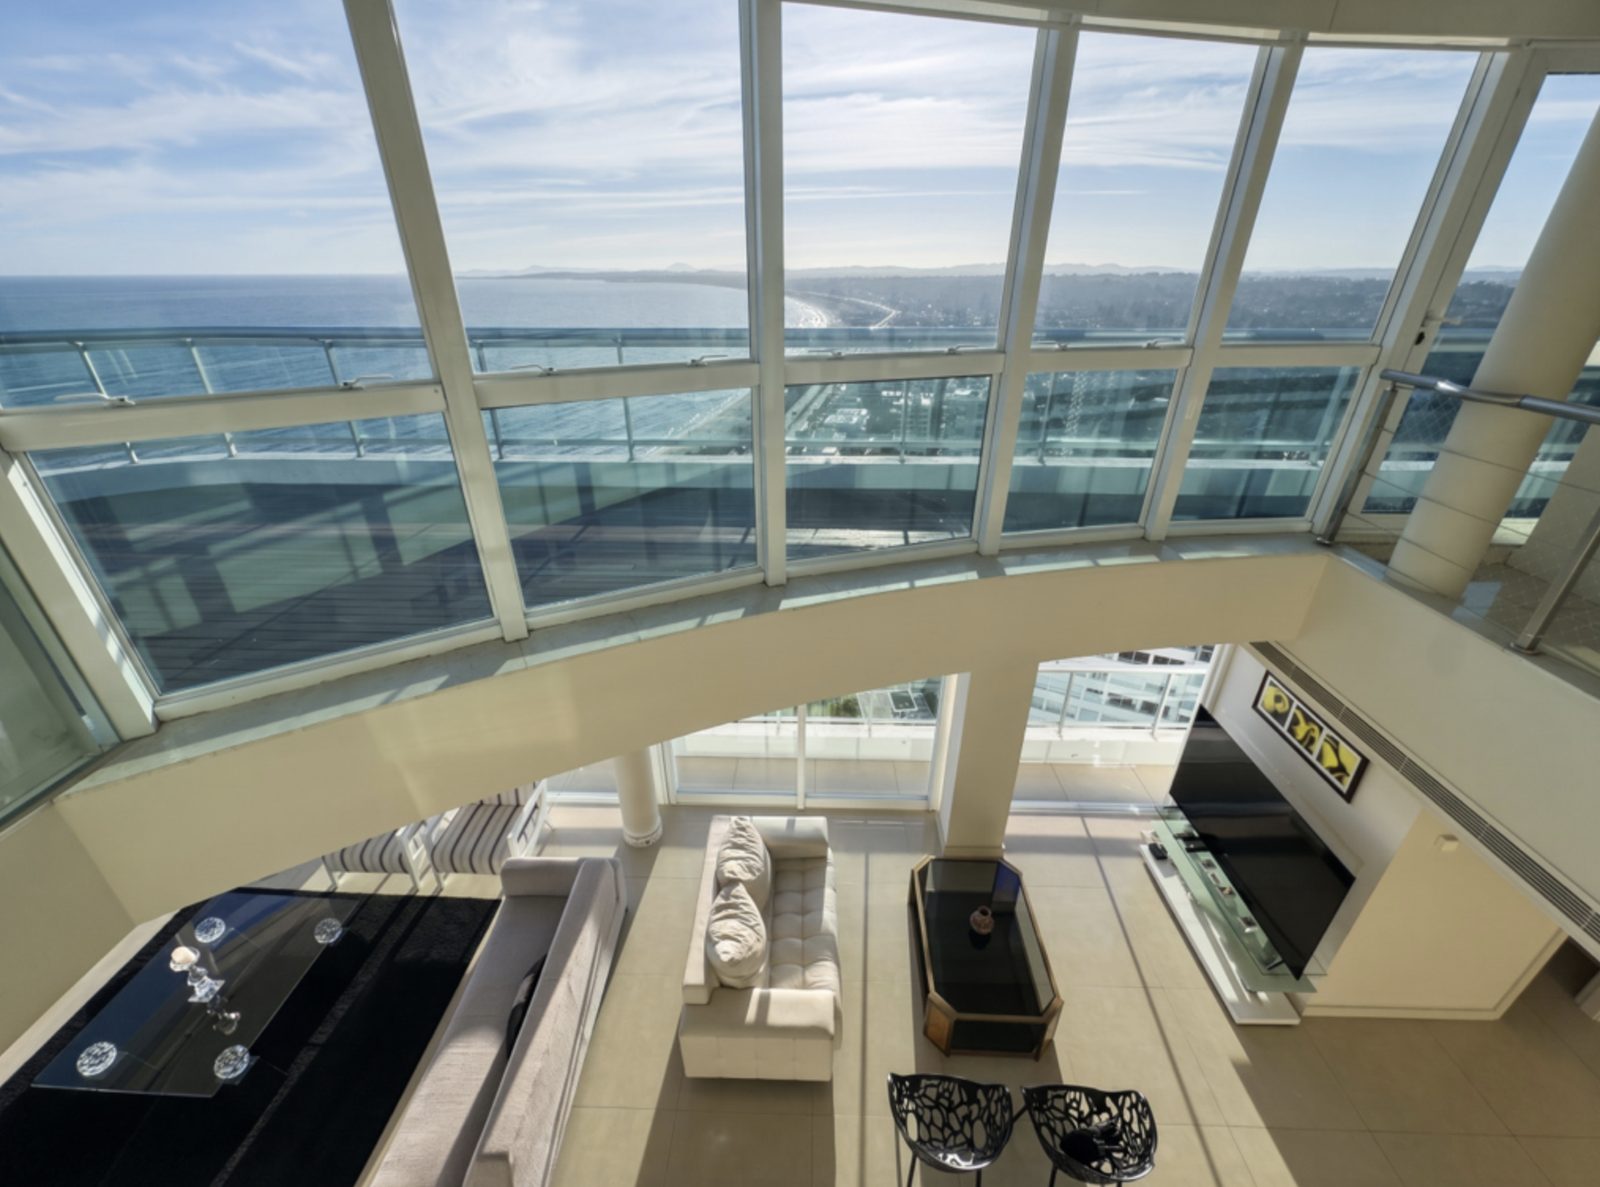
La Barra: the appreciation of the last cycle
La Barra is the clearest case of appreciation in the market: a 10% to 15% rise between 2022 and 2025. Prices of USD 4.500 to 9.000 per m², a young crowd, dining, and more and more life outside the season. For summer 2027, the 1st half of January for a 2-bedroom apartment is listed on average at USD 13.300 and a 3-bedroom house at USD 15.750; with a pool, more.
Manantiales: the premium market that keeps growing
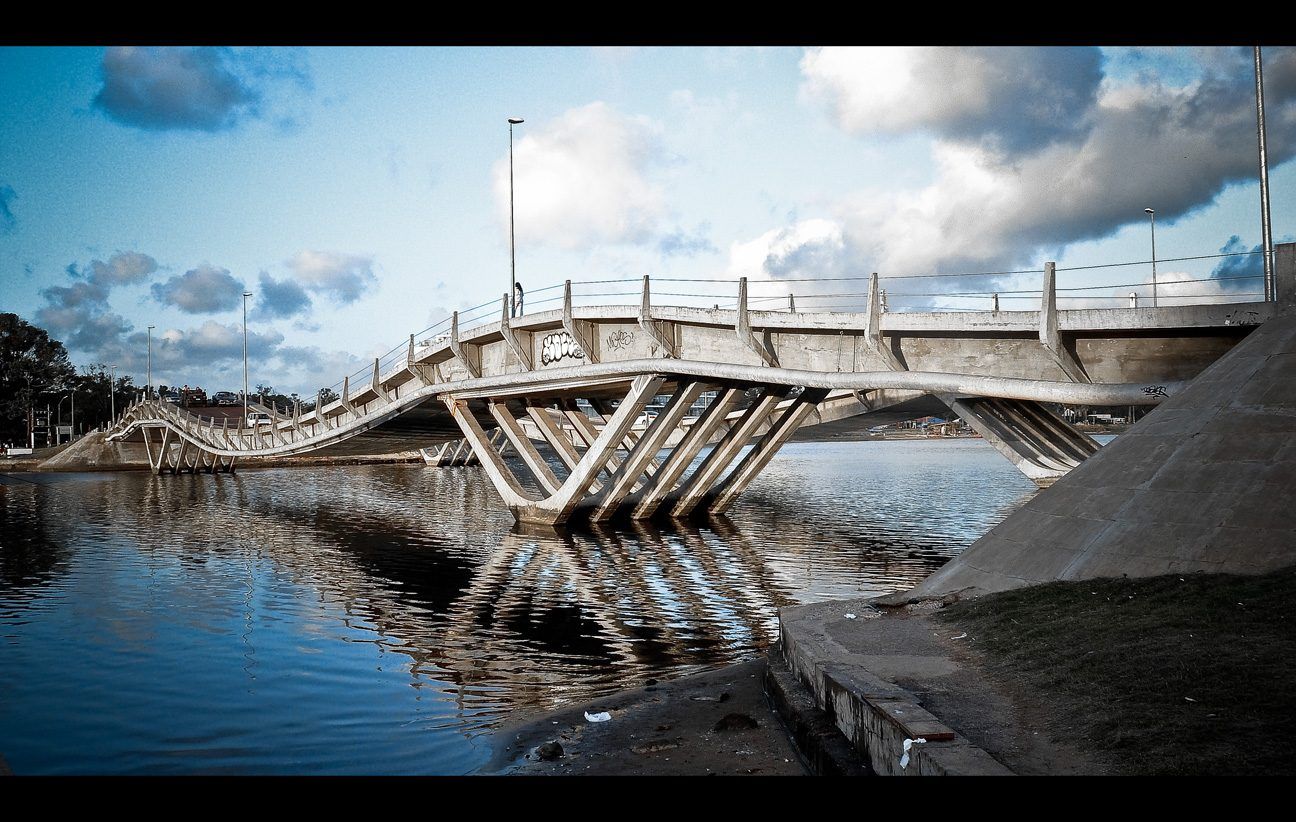
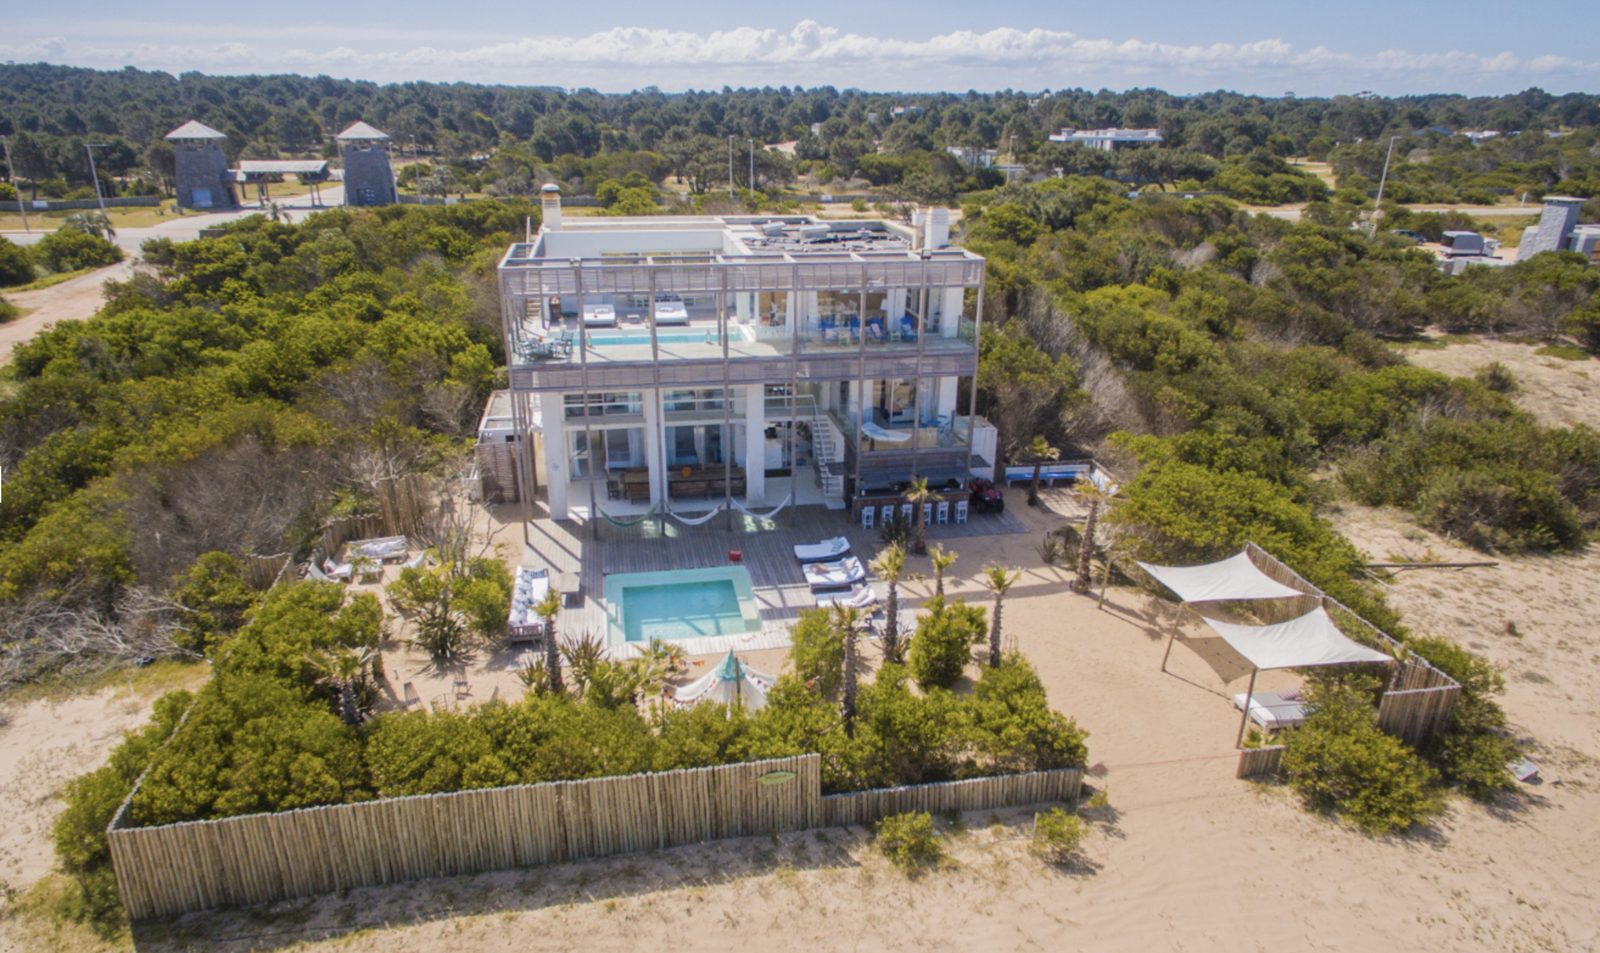
Manantiales shares a price range with La Barra (USD 4.500 to 9.000 per m²) at the top end, with high-end new product and a buyer profile seeking the area's brand cachet. Typical strategy: premium summer season plus appreciation potential.
José Ignacio: the top of the market, with a long horizon
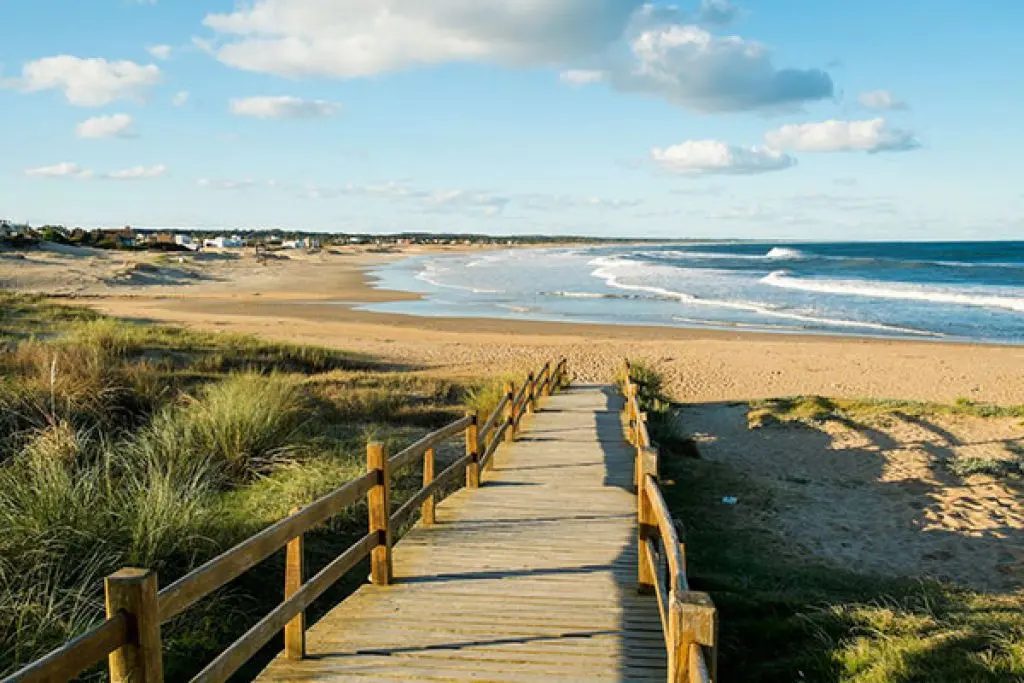
José Ignacio is the top of the market: USD 6.000 to 10.000+ per m². The flip side of the price tag is the summer rental, which here breaks away completely from the rest of the coast: in January there are country estates (chacras) renting for figures unmatched anywhere in the country, on the order of USD 200.000 for the month. These are off-market deals involving a handful of properties and a handful of tenants, but they set the ceiling for the area. As an investment it's long-horizon, more about wealth preservation than cash flow.
The inland neighborhoods: the most efficient year-round rental
On the other side of the avenue, the inland neighborhoods share the same lower entry ticket as the Roosevelt corridor: USD 2.800 to 4.500 per m². It's the zone for year-round residents and for investors who prioritize steady flow over the seasonal peak. Subsidized housing, at USD 2.500 to 4.500 per m² with tax benefits, tends to show up in this segment and in off-plan developments.
Note: these values are only averages. Many properties fall above and below these figures, depending on the exact area, the building, the size, the view and the condition.
Which area to choose based on your goal
The cross-reference between goal and zone, in a single view:
GOAL → RECOMMENDED AREA · REF. JULY 2026
Playa Brava · La Barra
Roosevelt · Inland neighborhoods
- Demand for year-round permanent housing
- Contracts from 1 to 2 years
La Barra · Manantiales
- La Barra: +10–15% between 2022 and 2025
Playa Mansa · Península
- Mixed strategy: January covers the year's expenses
Reference values, July 2026.
Rental income, appreciation or personal use: we'll show you specific units in the area that best fits your strategy.
| Goal | Zones | USD / m² | Why |
|---|---|---|---|
| Seasonal rental | Beachfront in Playa Brava, La Barra | 4.000–9.000 | Concentrate January and second-fortnight demand |
| Year-round rental | Roosevelt and inland neighborhoods | 2.800–4.500 | Where year-round demand lives, with the lowest entry price on the strip |
| Appreciation | La Barra, Manantiales | 4.500–9.000 | La Barra rose 10–15% between 2022 and 2025 |
| Personal use with partial rental income | Playa Mansa, Península | 3.500–6.500 | Year-round services and an established inventory |
| Low entry price | Promoted housing (usually off-plan) | 2.500–4.500 | Tax exemptions under Law 18.795 |
How we build these figures. These are Santiago Pereyra Propiedades' own estimates, built from real transactions in our portfolio and daily tracking of listings published in Punta del Este and Maldonado. They don't come from an official index: Uruguay has no public record of closing prices by zone. They are reviewed every quarter.
Three criteria before deciding on the area
- Seasonal rental: weigh the actual proximity to the beach and to dining. The 2025/26 season moved around 110.000 beds with more than 90% occupancy in January, but first- and second-line properties rent out first. How to work that market is in the guide to seasonal rental.
- Year-round rental: look for everyday-life areas (services, schools, supermarkets) rather than postcard areas. There, tenants stay 1 or 2 years and vacancy is minimal. If this profile interests you, also check out the guide to living in Punta del Este: the same map used by someone moving there is the one your future tenant uses.
- Appreciation: follow the construction: where there are developments, new dining and services year-round, price tends to follow. In 2026 there are more than 70 active developments; buying off-plan in the right area lets you capture the rise from the launch price, as we explain in the buying off-plan guide.
And one criterion across the board: total cost. Between the notary, the ITP and the commission, closing costs add up to 7% to 9% of the price in any area. For houses and plots (La Barra, Manantiales, the inland neighborhoods), the same logic applies: you can browse the houses for sale listings filtered by your strategy.
Frequently asked questions
What's the best area for seasonal rentals in Punta del Este?
The beachfront of Playa Brava and La Barra concentrate January demand: the 2025/26 season closed with more than 90% occupancy, with the first and second lines practically fully booked. In most cases, January's rental income covers the property's expenses for the whole year.
Where is it best to buy for year-round rental?
In the Avenida Roosevelt corridor and the inland neighborhoods, where the permanent demand lives. The entry ticket is the lowest in the area (USD 2.800 to 4.500 per reference m²) and the year-round lease is signed for 1 or 2 years, with adjustment by UI or UR.
Which area has the greatest potential for appreciation?
The clearest case of the last cycle is La Barra, with increases of 10% to 15% between 2022 and 2025, and Manantiales in the premium segment. Appreciation tends to go hand in hand with new construction, dining and year-round services.
How much do I need to invest in Punta del Este?
The price per m² ranges from USD 2.500 to 4.500 in tax-incentivized housing and USD 2.800 to 4.500 along the Roosevelt corridor and the inland neighborhoods, up to USD 6.000 to 10.000+ in José Ignacio. Add 7% to 9% in purchase costs on top of the price.
Sources
Reference ranges as of July 2026. Tell us your goal and your budget, and we'll tell you which neighborhood to look in, with specific building names.